Momentum Weakens, Tencent Stock Gains 1.31% Today
On Agustus 28, 2026: price 447.80 HKD, trend sideways, RSI 45.3, support 440.00, resistance 492.20. technical analysis of tencent stock.
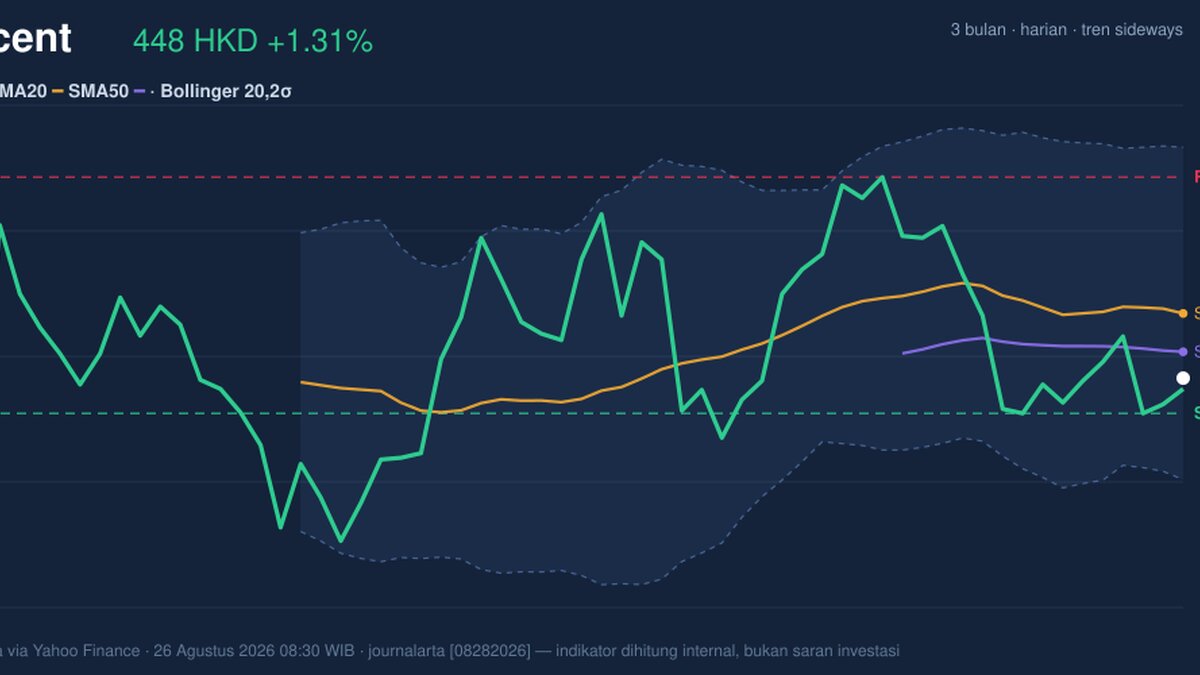
Tencent Holdings slipped in Hong Kong on Tuesday, with 0700.HK last changing hands at HKD 447.80, up 1.31% from the previous close of HKD 442.00, but still trading below its short- and medium-term trend lines, according to exchange data via Yahoo Finance as of 26 August 2026 08:30 WIB. The move matters less as a one-day bounce than as a test of whether the stock can stabilise after a -3.99% slide over the past month. Right now, the chart says Tencent is not breaking down in a straight line — but it is also not reclaiming control from sellers.
Trend & Price Action
The broader structure remains sideways, with the SMA20 at HKD 462.09 and the SMA50 at HKD 453.60, while the share price sits below both moving averages. That positioning is important: when price trades under the 20-day and 50-day averages, rallies often need more than a single strong session to prove they are more than short-covering. The SMA20 slope of -0.01% over 5 days is nearly flat, which tells readers the stock is not in a decisive downtrend, but the absence of a fresh MA-cross means there is no new trend reversal signal either. As shown in the chart, Tencent is sitting in the lower half of its recent range, with 3-month high at HKD 497.80 and 3-month low at HKD 411.00.
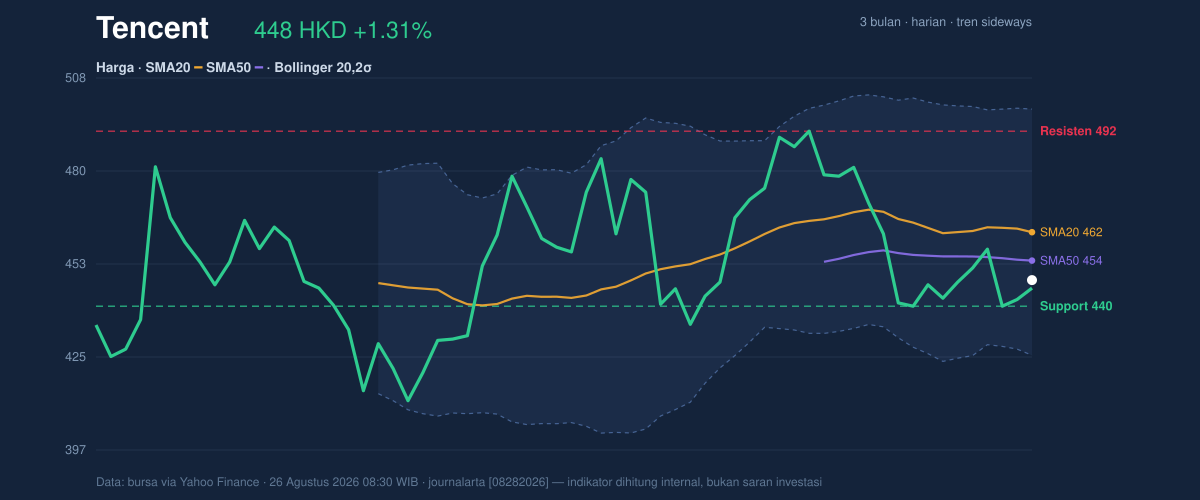
The price is not far from the lower end of that band.
That matters because the market is still deciding whether HKD 440 is a floor or just a pause.
Oscillators & Momentum
Momentum is mixed, and that is the most telling part of the setup. The RSI(14) at 45.3 is neutral, which means Tencent is neither stretched on the upside nor washed out on the downside. But the Stochastic %K at 19.7 and %D at 12.3 show the stock is in oversold territory, a sign that short-term selling pressure may be tiring even if a larger trend has not turned yet. The catch is the MACD at -4.432, below its signal line at -1.950, with a histogram of -2.482. That combination says downside momentum is still negative, and the gap between MACD and signal shows bears have not fully lost control. In plain English: the stock looks capable of a bounce, but the trend-following indicator still says the rebound has not been confirmed.
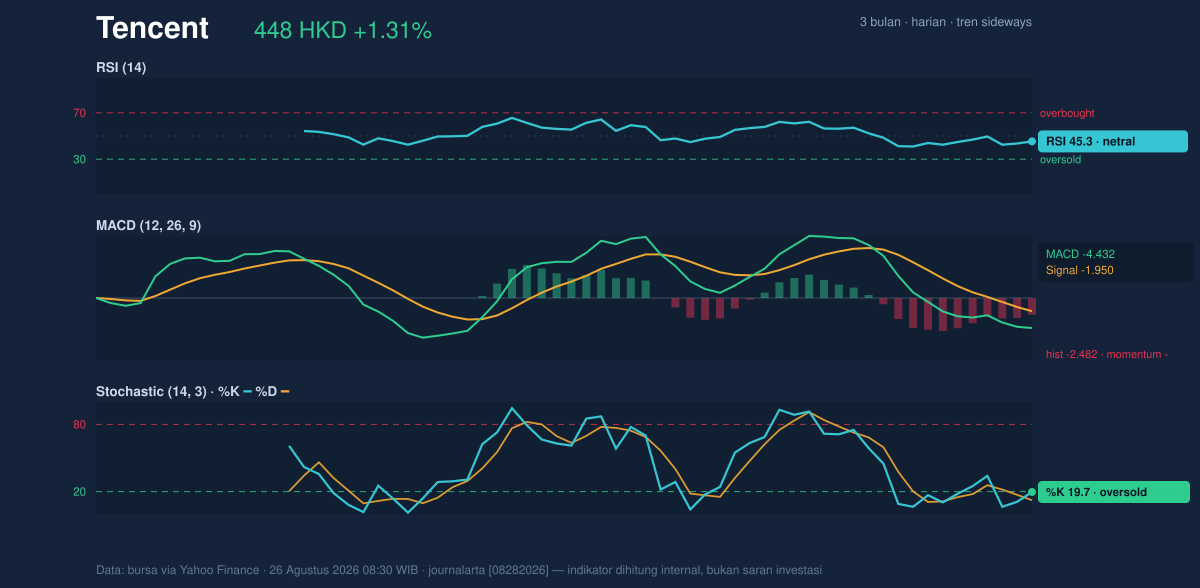
This is the kind of setup where traders watch for momentum to improve before trusting the move.
Without that, oversold can stay oversold.
Volatility & Volume
Volatility is active but not extreme. The ATR(14) at 11.49, equal to 2.6% of price, suggests normal daily movement rather than a panic regime. Bollinger Bands reinforce that reading: the upper band at HKD 498.82, middle band at HKD 462.09, and lower band at HKD 425.36 place the stock below the midline but above the lower band, with %B at 31%. That means Tencent is trading in the lower third of its volatility envelope, but not yet at the point where the band is being forcefully tested. The 15.9% band width is normal, so this is not a squeeze that often precedes a sudden expansion; instead, it suggests the market is already moving, just without conviction.
Volume is less supportive. The latest turnover of 14,643,242 compares with a 20-hour average of 25,575,524, or just 0.6x, and OBV is falling. That combination weakens the case for the recent rebound because a price rise on light participation often means buyers are not yet committing in size. Put differently, the stock is trying to stabilise without the crowd.
Key Levels & Scenarios
The immediate reference points are clear. The 20-hour support at HKD 440.00 is the first line to watch, while HKD 492.20 is the near-term resistance. The current price sits at roughly 15% of the range between those levels, which leaves room on both sides but keeps the stock closer to support than resistance. Below that, the Bollinger lower band at HKD 425.36 aligns with the broader 3-month low at HKD 411.00 as a deeper risk zone. Above, a move back toward the SMA50 at HKD 453.60 and then the SMA20 at HKD 462.09 would be needed to show that the bounce is doing more than filling a gap in sentiment.
If HKD 440.00 fails to hold, the market would likely revisit the lower band and then the 3-month low area. If price can reclaim the SMA50 and hold above it, the tone would improve materially because that would place Tencent back in the middle of its trend structure instead of the lower edge.
Technical Verdict: HOLD (wait & see)
HOLD (wait & see) is the cleanest reading because the stock has short-term oversold signals, but trend and participation are not yet confirming a durable recovery.
- Reason 1: RSI 45.3 is neutral, so the stock is not oversold enough to call a strong reversal, even though Stochastic 19.7 / 12.3 points to short-term exhaustion.
- Reason 2: MACD remains negative with a -2.482 histogram, which means downside momentum is still in place despite the day’s bounce.
- Reason 3: Price is below SMA20 and SMA50, and volume is only 0.6x average with OBV falling, so the rebound lacks confirmation.
- Verdict invalidated if price breaks below HKD 440.00, as that would expose the lower Bollinger band at HKD 425.36 and deepen the bearish structure.
- Ideal entry range: HKD 440.00 to HKD 453.60
- Exit target: HKD 462.09 to HKD 492.20
- Stop loss protection: below HKD 425.36
In plain English: Tencent is trying to steady itself, but the chart still needs proof before the move can be trusted.
“The market is waiting for Tencent to prove that this bounce has real buyers behind it.”
Summary Data Tencent
| Last price | 447.80 HKD |
| Change 1 day / 5 days / 1 month | 1.31% / 0.13% / -3.99% |
| Trend / MA-cross | sideways / none |
| SMA20 / SMA50 | 462.09 / 453.60 |
| RSI (14) / Stochastic %K | 45.3 / 19.7 |
| Bollinger %B / ATR | 31% / 11.49 |
| Support / Resistance 20 days | 440.00 / 492.20 |
| Data as of | 26 Agustus 2026 08:30 WIB |
Track Tencent share price daily: live levels, support/resistance and our full Tencent analysis history.