MRK Stock Drops 2.33% Today, Momentum Gains
On Agustus 28, 2026: price 149.54 USD, trend uptrend, RSI 64.4, support 127.77, resistance 156.45. technical analysis of mrk stock. MRK Stock Drops — full…
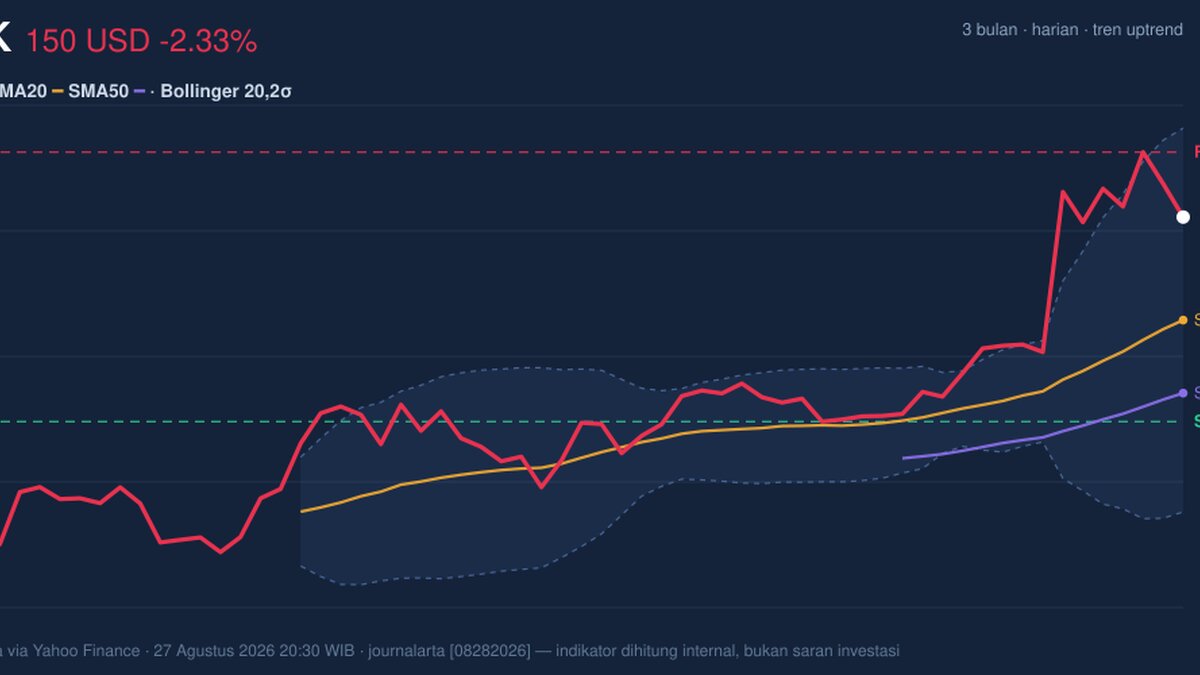
Merck is still trading in an uptrend, but the latest pullback shows the market is testing how much of that rally is already priced in. On 27 August 2026 at 20:30 WIB, the stock finished at 149.54 USD, down from 153.10 the previous close, even though it remains well above its short- and medium-term trend lines.
Trend & Price Action
The broader structure remains constructive. Merck is above its SMA20 at 138.58 and SMA50 at 130.79, which is the classic sign that buyers still control the intermediate trend. The SMA20 is also rising at 4.07% over 5 days, a useful signal because a rising moving average means recent prices have been strong enough to pull the trend line higher rather than flatten it out. In plain language, the stock is still climbing, but not in a straight line.
There is no fresh moving-average crossover, so the chart is not flashing a new trend acceleration signal. Instead, the message is continuation: the trend already exists, and price is now moving within it. That matters because the stock sits at about 76% of its 20-hour range, close enough to resistance to show strength, but not so close to the upper bound that the move looks exhausted.
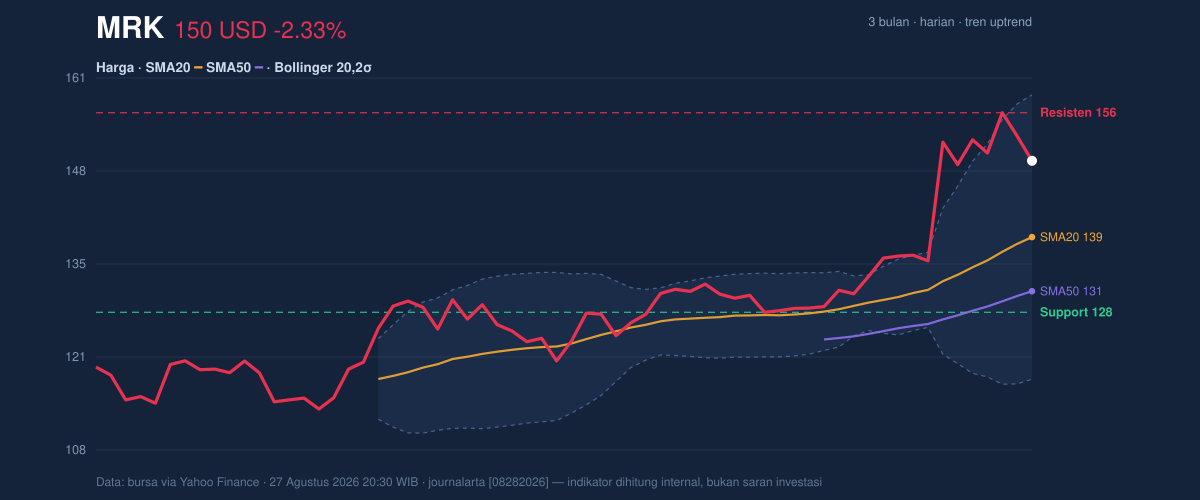
The Bollinger Bands help explain the current tension. Price is near the upper half of the band structure with %B at 77%, meaning the stock is trading closer to the top band than the middle band. That usually signals stronger-than-average price pressure, but it can also mean the move is extended. The band width is 29.5% and described as widening, which points to rising volatility. Wider bands are important because they often accompany stronger directional moves, but they also mean the stock can swing more sharply in either direction.
A short sentence says it best: the trend is intact, but the market is no longer moving quietly.
Oscillators & Momentum
Momentum is positive, though not overheated. The RSI at 64.4 sits in neutral territory, which tells us the stock is strong but not yet in a classic overbought zone. For general readers, RSI measures how fast and how far price has moved; readings above 70 often suggest a stretched move, while readings in the mid-60s suggest strength without obvious excess.
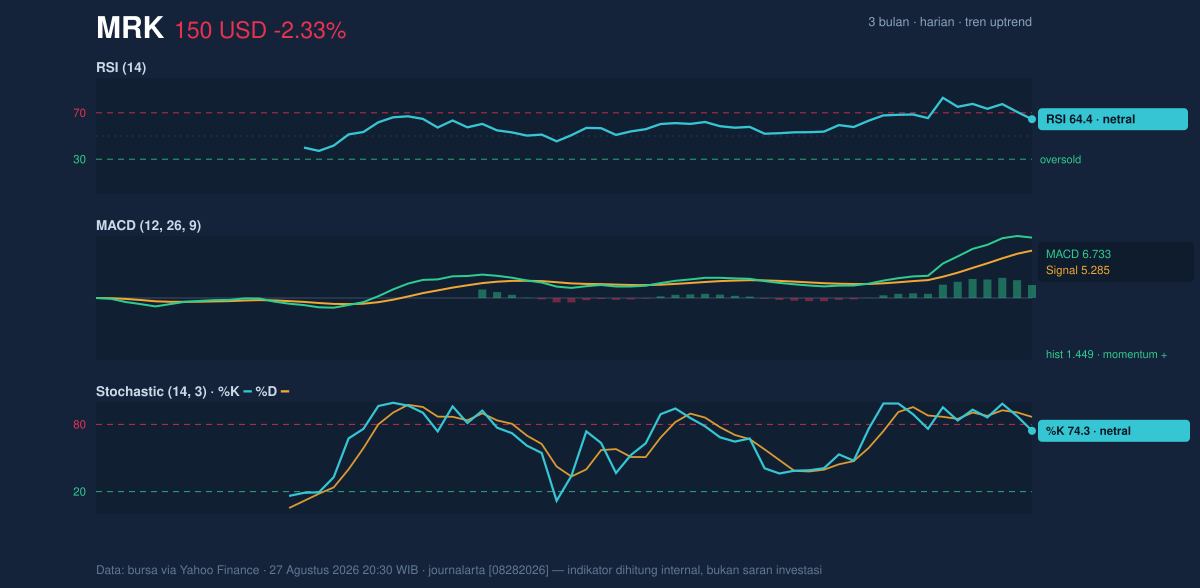
The stochastic oscillator is more elevated, with %K at 74.3 and %D at 86.7. That gap matters because stochastic is a short-term timing tool: it tends to rise when price is pressing toward the top of its recent range. Here, it implies momentum is still firm, but the stock may be nearer to a short-term pause than the start of a new acceleration. The MACD remains supportive, with MACD at 6.733 above its signal line at 5.285 and a positive histogram of 1.449. In simple terms, MACD is still confirming upward pressure because the faster trend line remains above the slower one.
That combination is notable: RSI is calm, stochastic is stretched, and MACD is still positive. This is not a bearish reversal setup; it is more consistent with a strong trend that may need time to digest gains.
Volatility & Volume
Volatility is present, but not chaotic. The ATR at 4.85, or 3.2% of price, suggests a normal-to-moderate daily swing range for a large-cap name like Merck. ATR, or average true range, is useful because it shows how much the stock typically moves in a day; a higher ATR means wider trading bands and less predictable intraday action.
Volume is the one area that tempers enthusiasm. The latest turnover of 8,522,600 shares is only 0.8× normal versus the 20-day average of 11,203,885. That means the latest price action is not being backed by unusually heavy participation. In technical terms, a rally or pullback on lighter volume can still be real, but it is less convincing than one confirmed by strong trading activity. The positive offset is that OBV is rising, which indicates that, over time, more volume has been associated with up days than down days. That is often a subtle but important sign that accumulation is still in place.
Merck is moving higher, but conviction is not loud.
Key Levels & Scenarios
The nearest technical map is clear. Support at 127.77 marks the lower boundary of the recent 20-hour range, while resistance at 156.45 is the immediate ceiling. The 3-month high at 156.92 sits just above that resistance, so the stock is approaching a zone where prior sellers have already appeared. On the downside, the 3-month low at 111.57 is far below current levels, reinforcing that the larger trend has already recovered meaningfully.
If Merck holds above the 138.58 SMA20 and continues to trade near the upper Bollinger area, the chart remains in constructive territory. If it fails to hold the rising short-term average, the first real warning would be a drift back toward 127.77, where recent support becomes the key test. A move through 156.45 would clear the local ceiling and bring the 156.92 3-month high back into focus, but the current volume backdrop suggests that any such breakout would ideally need stronger participation to be convincing.
Technical Verdict: HOLD (wait & see)
- MACD is positive, with the line above its signal and a bullish histogram, which keeps the trend bias constructive.
- Price remains above the SMA20 and SMA50, and the rising SMA20 slope confirms the uptrend is still intact.
- Bollinger Bands are widening and %B is 77%, which signals strength but also a more extended setup near resistance.
- Volume is only 0.8× normal, so the latest move lacks strong participation even though OBV is rising.
Verdict invalidated if price breaks below 127.77, because that would mean the nearest support has failed and the short-term structure is weakening.
- Ideal Entry Range: 138.58 to 127.77
- Exit Target: 156.45 to 156.92
- Stop Loss protection: below 127.77, with the deeper trend risk increasing if the move slips under 118.15
In plain English: Merck still looks healthy on the chart, but the stock is close enough to resistance that the next move needs confirmation rather than assumption.
Summary Data MRK
| Last price | 149.54 USD |
| Change 1 day / 5 days / 1 month | -2.33% / 0.37% / 15.22% |
| Trend / MA-cross | uptrend / none |
| SMA20 / SMA50 | 138.58 / 130.79 |
| RSI (14) / Stochastic %K | 64.4 / 74.3 |
| Bollinger %B / ATR | 77% / 4.85 |
| Support / Resistance 20 days | 127.77 / 156.45 |
| Data as of | 27 Agustus 2026 20:30 WIB |
Track MRK stock price daily: live levels, support/resistance and our full MRK analysis history.