NVDA Stock Gains 8.74% Today, Testing Key Resistance
On Agustus 28, 2026: price 227.98 USD, trend uptrend, RSI 61.2, support 200.75, resistance 227.98. technical analysis of nvda stock. NVDA Stock Gains — full…
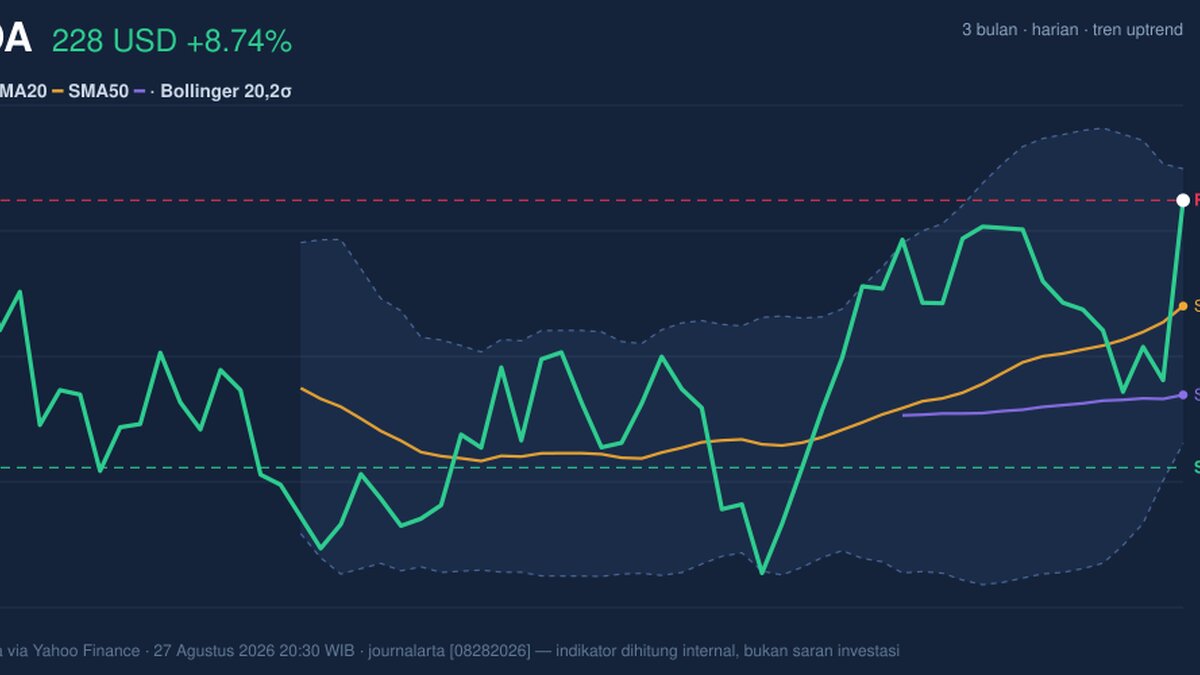
Nvidia rose to 227.98 USD on Nasdaq on 27 August 2026, up 8.74% from the prior close of 209.66, and the move pushed the shares to the top of their recent trading range. The stock is still in an uptrend, but the chart now shows a market that has advanced quickly enough to test both momentum and patience.
Trend & Price Action
The first thing the price structure says is simple: Nvidia is trading above SMA20 at 217.21 and above SMA50 at 208.16, which keeps the broader trend constructive. The SMA20 slope of 2.08% over 5 days matters because it shows the short-term average is still rising, not flattening out. That usually means buyers have been willing to pay up for the shares, even after a strong run.
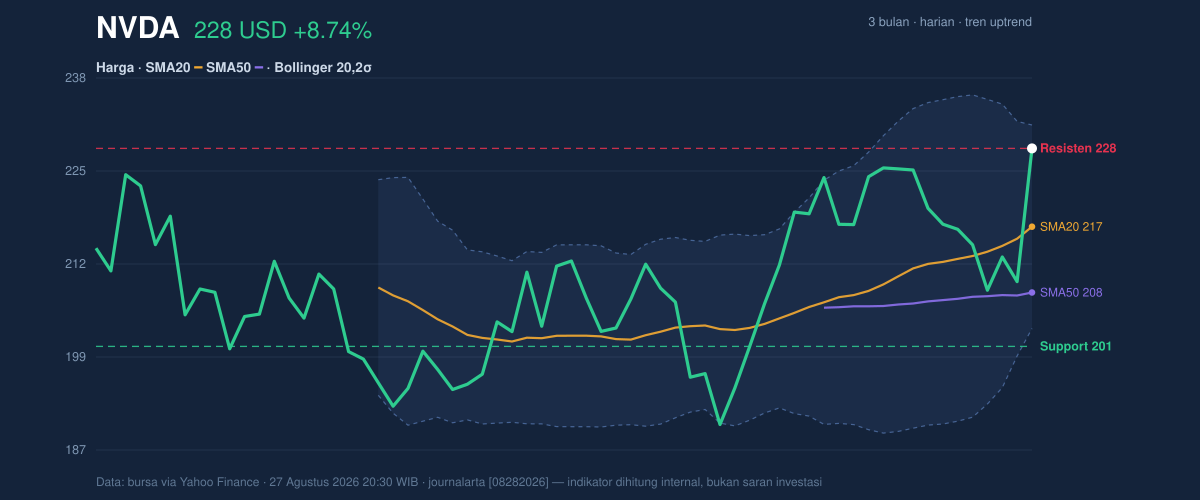
The stock is also sitting at 100% of its 20-hour range, with 20-hour resistance at 227.98 and 20-hour support at 200.75. In plain terms, Nvidia has not just recovered; it has moved to the edge of the recent ceiling. The 3-month high of 232.28 is now the nearest obvious reference point, while 189.80 marks the lower end of that broader range. That tells readers the market is testing whether this rally is a fresh leg higher or simply a fast move into known resistance.
The Bollinger Bands help explain that pressure. With the upper band at 231.20, middle band at 217.21, and lower band at 203.21, the shares are trading close to the top of the band structure, at a %B of 88%. That is not a crash signal; it is a signal that price is stretched toward the upper end of its normal envelope. The 12.9% band width is described as normal, so this is not a volatility squeeze waiting to explode. It is more a case of price already doing the heavy lifting.
Oscillators & Momentum
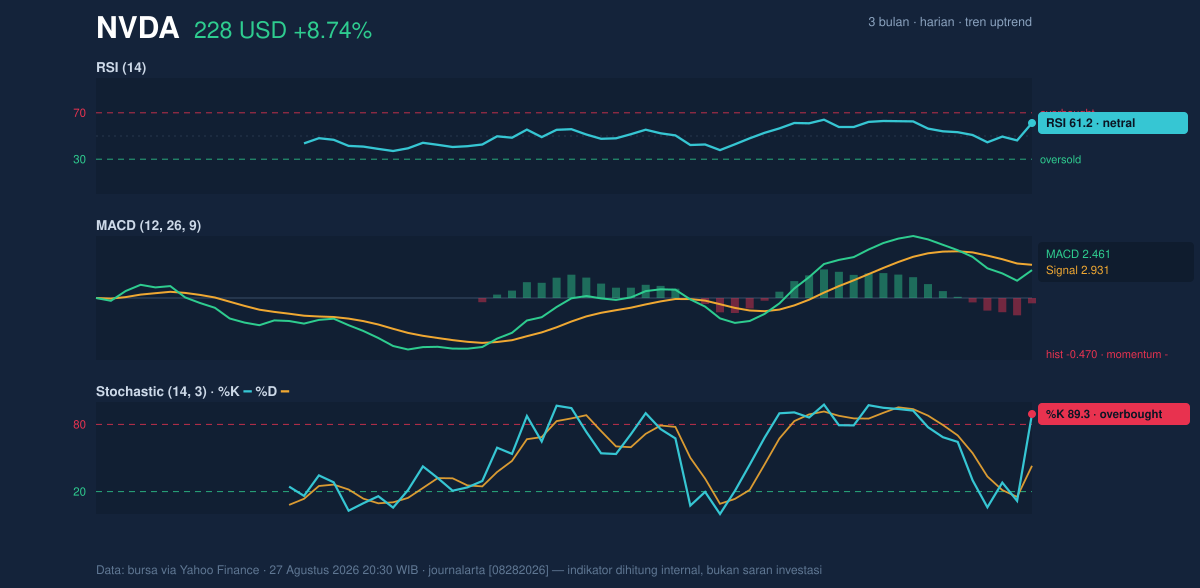
Momentum is where the story becomes more nuanced. The RSI at 61.2 is still neutral, which means the stock is not yet in a classic overbought condition on that measure. But the Stochastic %K at 89.3 versus %D at 43.0 is a much hotter reading. Stochastic is a shorter-term momentum gauge, so when it climbs that far above its signal line, it often means the latest move has become extended and may be vulnerable to pauses or pullbacks.
The MACD at 2.461 remains above zero, which usually supports the idea of an uptrend, but the signal line at 2.931 is higher and the histogram at -0.470 is negative. That combination matters: it means the trend is still positive in a broad sense, but the pace of upward momentum has weakened relative to the recent average. In other words, the shares are rising, but the acceleration is no longer as strong as the price action alone might suggest.
That divergence is reinforced by volume behavior. The latest 298,231,200 shares traded were about 2.4× the 20-hour average of 125,104,845. Heavy volume on a strong up day usually signals real participation, not a thin move. Yet OBV is down, which is a warning that cumulative volume flow has not fully confirmed the price surge. When price jumps but OBV falls, it often means the market is rallying on bursts of demand rather than a steady accumulation trend.
Volatility & Volume
The ATR(14) of 6.51, equal to 2.9% of price, points to moderate volatility. That is important because it frames how far the stock can reasonably swing without changing character. A move of this size can still happen quickly in Nvidia, but the current reading does not suggest panic or disorder; it suggests active trading with enough room for intraday pullbacks.
The broader signal from volume is mixed but important. A 2.4× volume spike shows strong attention from the market, yet the falling OBV says not all of that activity has translated into durable accumulation. This is often what a late-stage push looks like: strong participation, but not all of it necessarily supportive of a clean continuation.
Key Levels & Scenarios
The immediate technical map is tight. 227.98 is both the latest price and the current resistance reference. Above that, the next visible marker is the upper Bollinger Band at 231.20, followed by the 3-month high at 232.28. Below, the first layer of support is the SMA20 at 217.21, then the Bollinger middle band at 217.21, and deeper support sits at 203.21, with 200.75 as the 20-hour support line.
If the price can hold above 217.21, the chart keeps its bullish structure intact. If it slips back under that area, the message changes: the rally would be showing less follow-through and more exhaustion. A break below 203.21 would be more serious because it would mean the stock has moved back through the lower half of its recent volatility band.
Technical Verdict: HOLD (wait & see)
HOLD (wait & see)
- The trend is still constructive because price is above SMA20 at 217.21 and above SMA50 at 208.16.
- Momentum is less convincing: Stochastic is overbought at 89.3 and MACD histogram is negative at -0.470, which suggests the rally is extended and losing some pace.
- Volume is strong at 2.4× average, but OBV is down, so price strength is not yet fully confirmed by cumulative flow.
Verdict invalidated if price breaks below 203.21.
- Ideal Entry Range: 217.21 to 203.21
- Exit Target: 231.20 to 232.28
- Stop Loss protection: 200.75
In plain English: Nvidia still looks strong, but the chart is close enough to resistance that the next move matters more than the last one.
Summary Data NVDA
| Last price | 227.98 USD |
| Change 1 day / 5 days / 1 month | 8.74% / 5.13% / 16.89% |
| Trend / MA-cross | uptrend / none |
| SMA20 / SMA50 | 217.21 / 208.16 |
| RSI (14) / Stochastic %K | 61.2 / 89.3 |
| Bollinger %B / ATR | 88% / 6.51 |
| Support / Resistance 20 days | 200.75 / 227.98 |
| Data as of | 27 Agustus 2026 20:30 WIB |
Track NVDA stock price daily: live levels, support/resistance and our full NVDA analysis history.