ORCL Stock Gains 2.06%, Golden Cross Formed In Focus
On Agustus 28, 2026: price 151.94 USD, trend uptrend, RSI 57.0, support 129.87, resistance 156.22. technical analysis of orcl stock. ORCL Stock Gains — full…
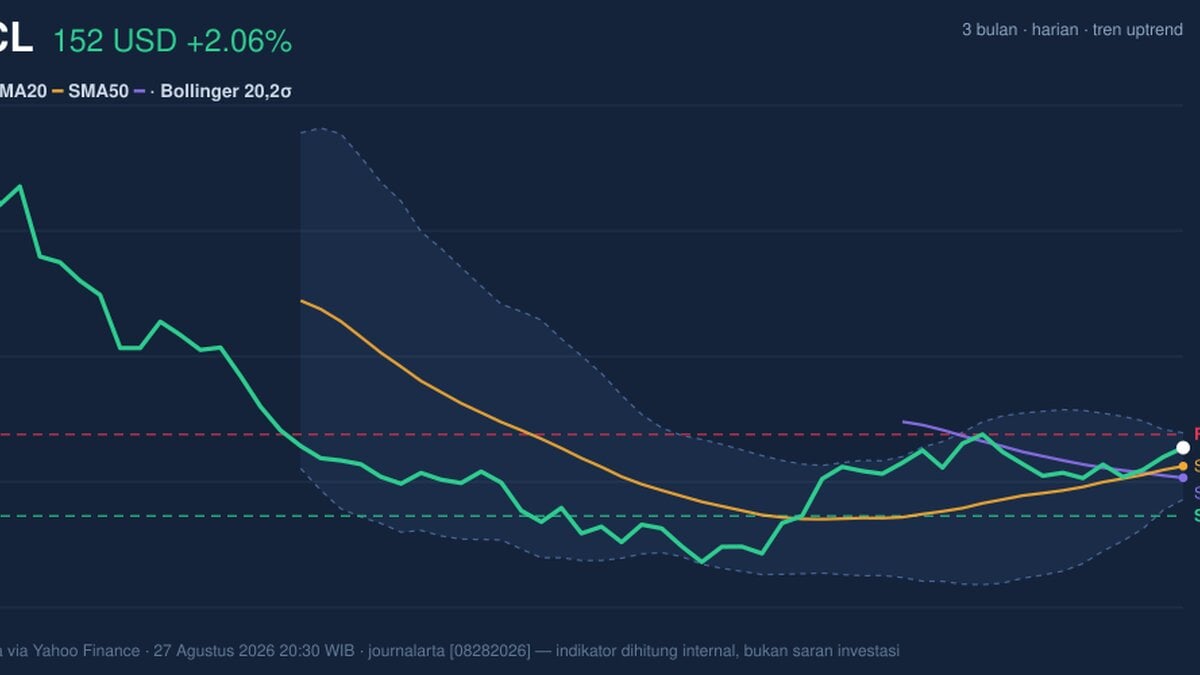
Oracle is trading with a clear bullish bias, but the recent climb has pushed the stock close enough to resistance that the next move matters more than the last one. On the New York Stock Exchange, ORCL last changed hands at 151.94 USD, up 2.06% on the day, after a 6.95% gain over 5 days and a 19.11% rise over 1 month, according to Yahoo Finance data cited at 27 August 2026 20:30 WIB.
Trend & Price Action
The price sits above the 20-day moving average at 145.93 and also above the 50-day moving average at 142.20, which is important because it shows the stock is trading above both its short- and medium-term trend gauges. More importantly, the chart shows a golden cross, meaning the faster 20-day average has moved above the slower 50-day average — a classic signal that recent buying pressure has overtaken the older trend. The slope of the 20-day average is also rising, at 4.82% over 5 days, which confirms the trend is still climbing rather than flattening out.
The stock is not drifting randomly higher; it is moving with structure.
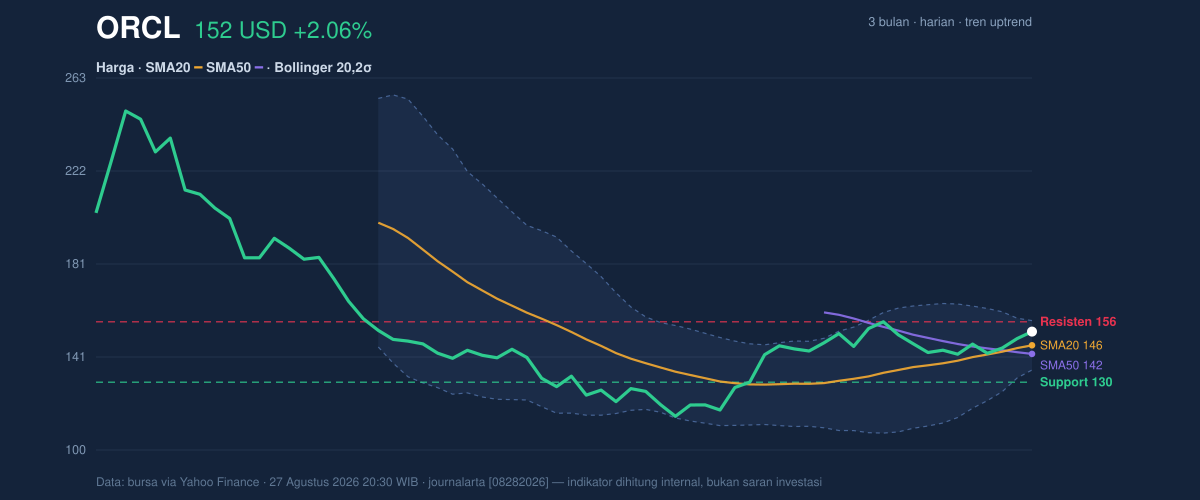
The current price is also sitting near the upper part of its recent trading band, at 84% of the 20-hour range, with support at 129.87 and resistance at 156.22. That positioning matters: when a stock is this close to the top of its range, buyers are still in control, but they are also testing how much demand remains before the move stalls or extends.
The chart shows momentum is strong — but it is no longer cheap.
Oscillators & Momentum
The momentum tools are supportive, though not overheated. RSI at 57.0 is still in neutral territory, which means the stock is not flashing an overbought warning even after the recent run. That matters because a strong trend can keep rising while RSI stays below the “too hot” zone. In plain language, the market is leaning bullish, but it has not yet reached the kind of stretched condition that often precedes a sharp pullback.
The stochastic reading tells a similar story. Stochastic %K at 66.5 and %D at 50.8 are also neutral, but with %K above %D, short-term price momentum is still improving. Meanwhile, MACD at 1.519 sits above the signal line at 0.671, and the histogram at 0.848 remains positive. For readers unfamiliar with the term, MACD measures whether recent price movement is accelerating or fading; a positive histogram means acceleration is still on the buyers’ side.
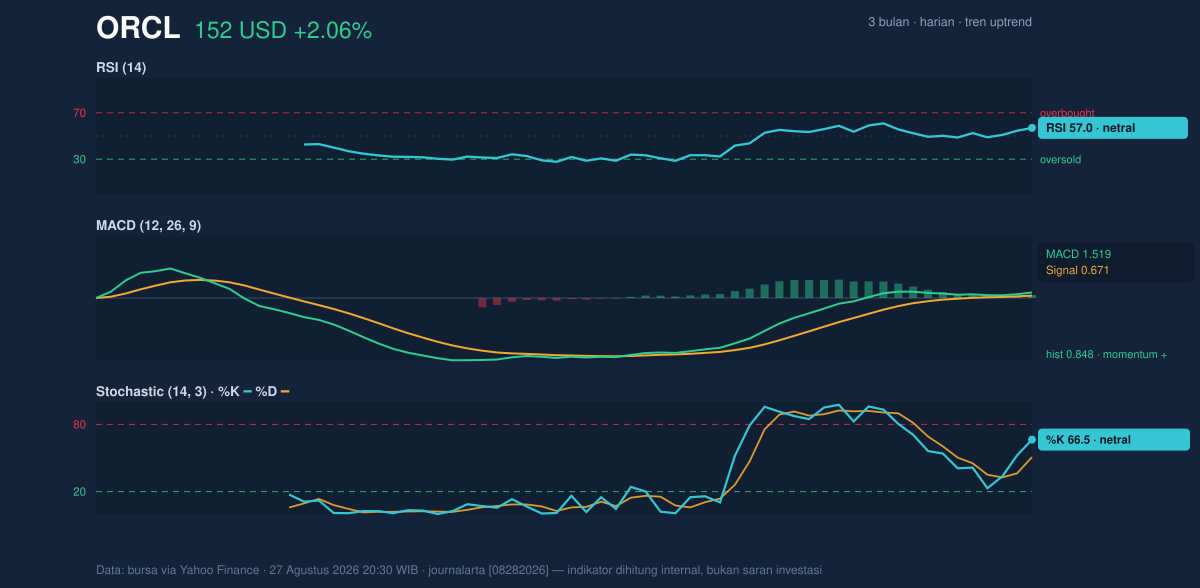
The key point is that momentum is aligned, not euphoric.
That is usually a healthier setup than a rally that looks exhausted.
Volatility & Volume
Volatility is elevated enough to matter. ATR at 6.35, or 4.2% of price, indicates the stock can move meaningfully in a single session. ATR is a measure of typical daily range, so a reading this high suggests traders should expect wider swings than the average large-cap name. That is not a bearish signal by itself; it simply means the stock is active and can reach levels faster than calmer shares.
Bollinger Bands add another layer. The upper band is 156.70, the middle band is 145.93, and the lower band is 135.17. The stock’s %B at 78% shows price is trading in the upper portion of that volatility envelope, but not yet pressing fully against the ceiling. The 14.8% band width is described as normal, which suggests this is not a squeeze waiting to explode; instead, it is a trend already in motion with room to continue if buyers keep showing up.
Volume supports the move. Last volume was 30,148,300, compared with a 20-day average of 25,940,860, or about 1.2× normal. Rising price on above-average participation is meaningful because it suggests the move is being confirmed by real trading interest rather than thin, fragile turnover. The OBV is rising, which reinforces that message: more volume has been flowing into the stock than out of it.
Key Levels & Scenarios
The immediate test is whether Oracle can stay above the mid-140s and push through the high-150s zone. Resistance at 156.22 sits just under the upper Bollinger band at 156.70, making that area a natural ceiling. If price clears that band cluster, the chart would show a stronger continuation signal because it would mean ORCL is not just trending upward, but doing so with enough force to move beyond the current volatility envelope.
On the downside, the first meaningful line of defense is the 20-day moving average at 145.93, which also matches the Bollinger middle band. If that fails, attention shifts toward support at 129.87. A break below that level would weaken the bullish structure materially, especially since the stock is currently well above it and the move has already advanced sharply over the past month.
The 3-month range also gives context: 250.25 is the upper extreme and 114.50 is the lower extreme. Oracle is still far below the three-month high, which means the rally has room to recover further ground, but it is also well above the low, which tells us the rebound is already substantial.
Technical Verdict: HOLD (wait & see)
HOLD (wait & see)
- MACD remains positive and the golden cross confirms the trend is still constructive.
- RSI at 57.0 and Stochastic at 66.5/50.8 are supportive but not yet decisive enough to suggest a clean breakout.
- Price near resistance at 156.22 and the upper Bollinger band at 156.70 means the stock is approaching a level where momentum must prove itself again.
Verdict invalidated if price falls below 145.93, because that would mean the stock has lost the 20-day trend line and the Bollinger middle band at the same time.
- Ideal Entry Range: 145.93 to 156.22
- Exit Target: 156.70
- Stop Loss Protection: 129.87
For non-traders, this means Oracle is still strong, but it is now at the point where the market has to decide whether the rally has more fuel or is pausing near resistance.
“The stock is strong, but the next move will tell us whether this is a pause or a push into a new leg higher.”
Summary Data ORCL
| Last price | 151.94 USD |
| Change 1 day / 5 days / 1 month | 2.06% / 6.95% / 19.11% |
| Trend / MA-cross | uptrend / golden |
| SMA20 / SMA50 | 145.93 / 142.20 |
| RSI (14) / Stochastic %K | 57.0 / 66.5 |
| Bollinger %B / ATR | 78% / 6.35 |
| Support / Resistance 20 days | 129.87 / 156.22 |
| Data as of | 27 Agustus 2026 20:30 WIB |
Track ORCL stock price daily: live levels, support/resistance and our full ORCL analysis history.