PANW Stock Analysis: Gains 12.83%, Momentum Weakens
On Agustus 28, 2026: price 382.85 USD, trend uptrend, RSI 60.4, support 331.83, resistance 396.00. technical analysis of panw stock. PANW Stock Analysis — full…
Palo Alto Networks rose to 382.85 USD on Nasdaq, up 12.83% in a day, and the move matters because it pushed the stock well above its short-term average while leaving it just below a nearby ceiling that has already started to matter to traders. The message from the chart is not simply that PANW is stronger; it is that buyers have regained control of the trend, but the advance is now entering an area where momentum, volume, and overhead resistance need to stay in sync.
Trend & Price Action
As shown in the chart, PANW is trading above its SMA20 at 364.87 and also above its SMA50 at 341.63, which is the simplest sign that the stock is in an established uptrend rather than a short-lived rebound. The SMA20 slope of 2.40% over 5 days shows that the shorter trend line is still rising, which usually means recent buying has been strong enough to pull the average higher.
The stock’s position also matters. At 382.85, PANW sits near the upper part of its recent range, with 20-hour support at 331.83 and 20-hour resistance at 396.00. That places the price at roughly the upper end of the range, which is constructive but also less forgiving: when a stock trades close to resistance, the market is often asking whether the next wave of demand is strong enough to break through or whether traders will take profits first.
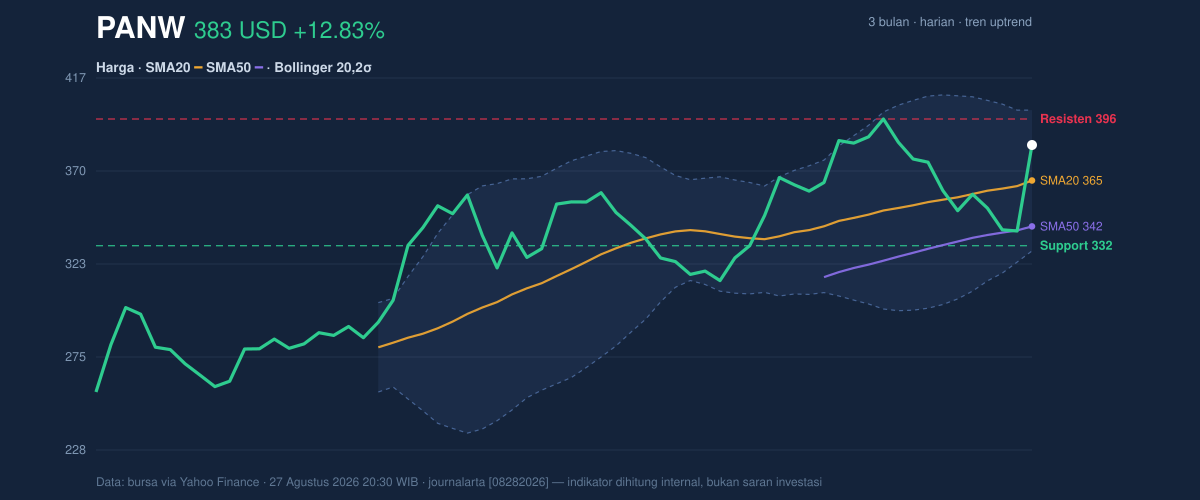
The broader range gives that move more context. PANW’s 3-month high is 398.88, only slightly above the current resistance zone, while the 3-month low is 248.41. That tells readers the stock has already recovered a large portion of its prior drawdown, but it has not yet proven it can clear the old peak. In practical terms, the price is approaching a decision point rather than a finish line.
Oscillators & Momentum
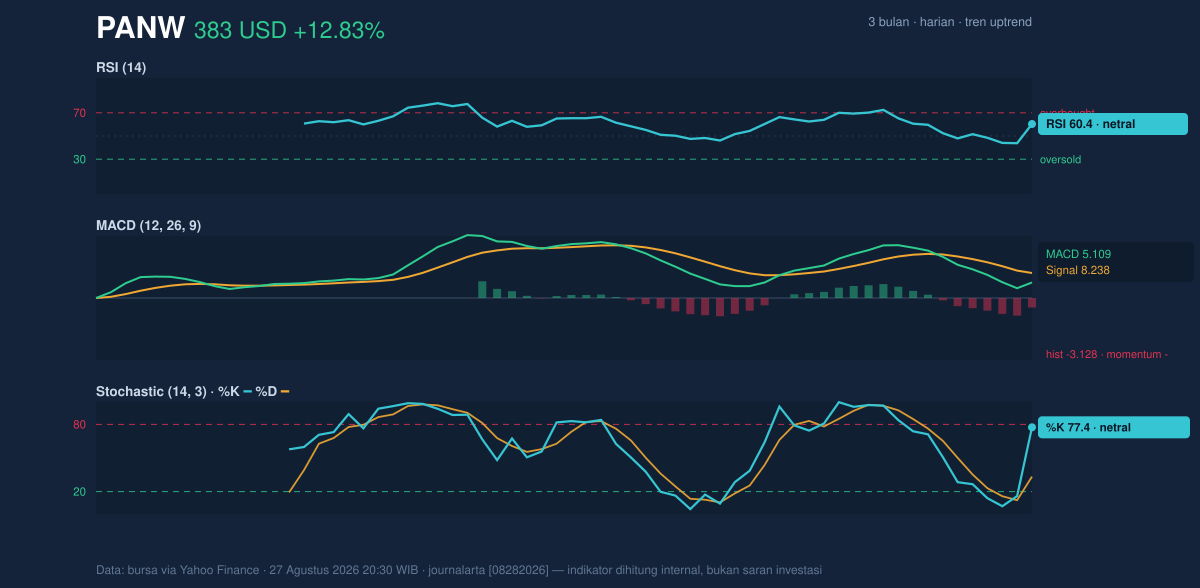
The oscillator picture is mixed, and that is the key nuance in this name. The RSI at 60.4 is still neutral, which means the stock is not yet in a classic overbought condition, even after the sharp daily gain. That leaves room for further upside, but it does not confirm that the move is fully powered by fresh momentum.
The Stochastic reading of 77.4 / 33.4 is also neutral, but the split between %K and %D suggests the short-term pace has improved faster than the slower signal line. That often happens when a stock is accelerating, but it can also be an early sign that the move is getting stretched. The more important warning comes from MACD: MACD 5.109 is still below the signal line at 8.238, with a histogram of -3.128. In plain English, that means the longer-momentum gauge is still negative even though the price is rising. This is the kind of setup that can occur early in a recovery: price improves before the trend-following indicator fully turns.
That combination matters. A rising price with a negative MACD histogram is not a breakdown, but it is a reminder that the rally has not yet earned full confirmation from trend momentum. Traders often watch for the histogram to narrow or turn positive as evidence that buying pressure is broadening rather than simply bouncing.
Volatility & Volume
PANW is moving with real force, not just drifting. The ATR(14) of 17.53, equal to 4.6% of price, signals elevated daily movement. That means the stock can travel a meaningful distance in either direction without necessarily changing its broader trend. For readers, ATR is a measure of how much a stock typically moves in a day; a higher reading means wider swings and less room for complacency.
The Bollinger Band setup is also telling. Price is at %B 75%, which means it is trading in the upper portion of the band structure but not at the extreme edge. The bands themselves are not especially tight, with a 19.5% width, described here as normal. That argues against a classic squeeze breakout setup and instead points to a stock that is already in motion. The upper band at 400.52 now sits just above resistance, so the market is close to a zone where upside extension becomes harder unless volume keeps supporting the move.
Volume is doing part of the job. Last trade volume of 7,298,300 is about 1.3× the 20-day average of 5,510,130, which suggests participation is stronger than usual. But the OBV is down, and that is the caution flag. OBV, or on-balance volume, tracks whether volume is supporting up days or down days over time. A falling OBV while the price rises can mean the rally is not yet fully confirmed by broader accumulation. In other words, there is buying interest, but not enough evidence yet that it is overwhelming supply.
Key Levels & Scenarios
The immediate map is clear. Support at 364.87 aligns with the SMA20 and the Bollinger middle band, making it the first important line where buyers would want to defend the trend. Below that, 331.83 is the next major support and also the lower end of the recent trading range. On the upside, 396.00 is the nearest resistance, with 400.52 as the Bollinger upper band and 398.88 as the 3-month high sitting just above it.
If PANW holds above 364.87, the chart continues to favor trend continuation. If it breaks through 396.00 with volume staying above average, the stock would be pressing into the area of its recent high and upper band, where momentum would be tested more seriously. If it loses 364.87, the rally would look less secure and the market would likely start focusing on 331.83 as the next defense point.
Technical Verdict: HOLD (wait & see)
- Reason 1: Price is above SMA20 364.87 and SMA50 341.63, which keeps the broader trend constructive.
- Reason 2: MACD is negative with the histogram at -3.128, so momentum has not fully confirmed the price strength.
- Reason 3: Volume is 1.3× normal, but OBV is down, which weakens the confirmation from participation.
- Verdict invalidated if price breaks below 364.87, because that would mean the stock has slipped back under the short-term trend and middle Bollinger band.
- Ideal Entry Range: 364.87 to 372.00
- Exit Target (Target Price): 396.00 to 400.52
- Stop Loss protection: 331.83
In plain English: PANW looks strong, but the chart is still asking for proof that the rally can keep going without losing momentum.
Summary Data PANW
| Last price | 382.85 USD |
| Change 1 day / 5 days / 1 month | 12.83% / 9.52% / 17.55% |
| Trend / MA-cross | uptrend / none |
| SMA20 / SMA50 | 364.87 / 341.63 |
| RSI (14) / Stochastic %K | 60.4 / 77.4 |
| Bollinger %B / ATR | 75% / 17.53 |
| Support / Resistance 20 days | 331.83 / 396.00 |
| Data as of | 27 Agustus 2026 20:30 WIB |
Track PANW stock price daily: live levels, support/resistance and our full PANW analysis history.