Shell Stock Analysis: Drops 2.23%, Testing Support Level
On Agustus 28, 2026: price 3,311.00 GBp, trend sideways, RSI 56.6, support 3,277.50, resistance 3,440.00. technical analysis of shell stock.
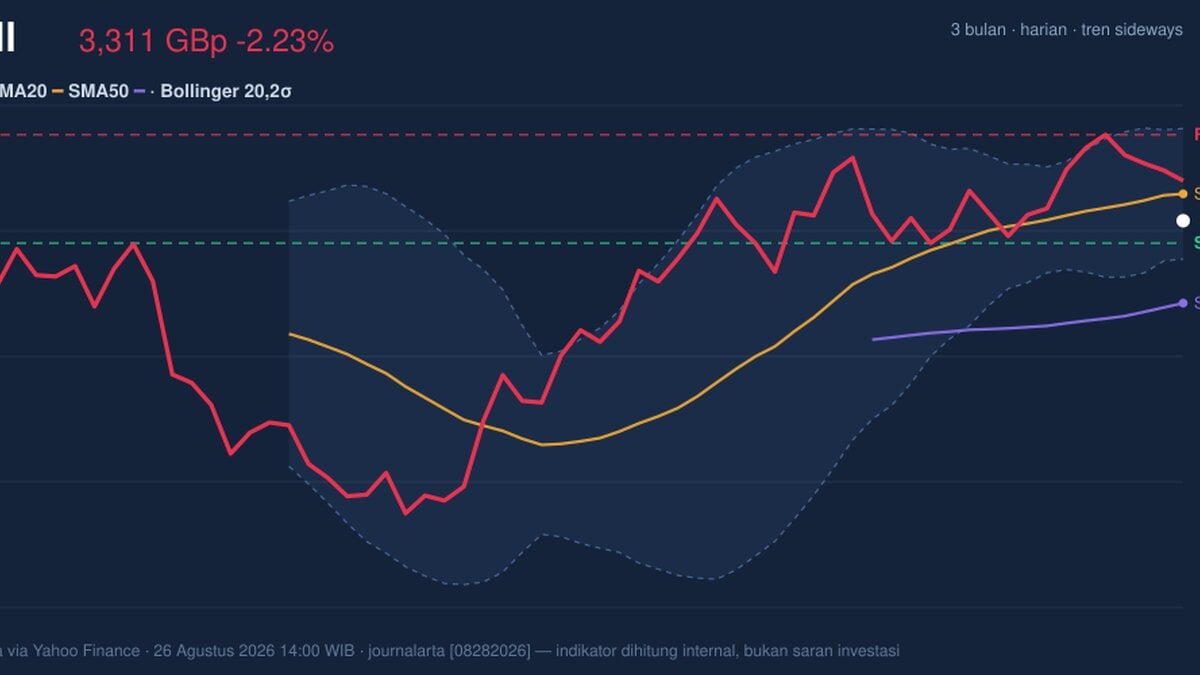
Shell plc fell on the London Stock Exchange in afternoon trade on 26 August 2026, with the shares last changing hands at 3,311.00 GBp, down 2.23% on the day and sitting below the previous close of 3,386.50. The move matters because it leaves the stock in a technically fragile middle ground: not in outright breakdown territory, but also not yet reclaiming the short-term trend line that would suggest buyers are back in control.
Trend & Price Action
The share price is still moving in a sideways pattern, but the balance of evidence has tilted slightly weaker in the near term. As shown in the chart, Shell is trading below SMA20 at 3,351.45 while remaining above SMA50 at 3,187.57, which usually means the medium-term floor is intact even as the shorter-term trend has lost momentum. That split is important: price under the 20-day average often signals fading immediate demand, while holding above the 50-day average suggests the broader structure has not yet broken.
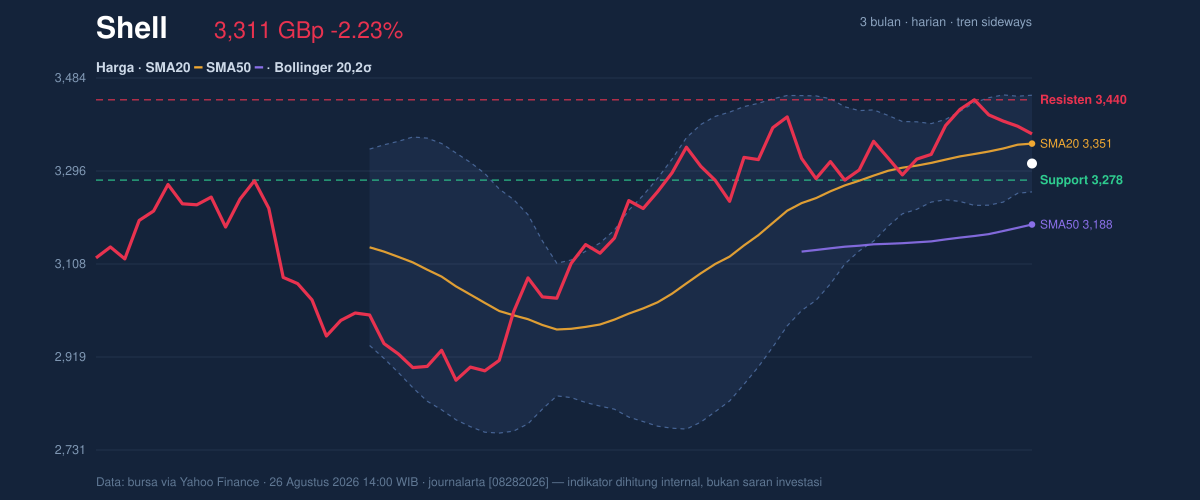
The slope of the 20-day average is still positive at 0.78% over 5 days, so the trend has not fully rolled over. Yet the market is only occupying 21% of the 20-hour range, near the lower end rather than the middle, and that positioning tells traders the stock is leaning toward support rather than probing resistance. The 20-hour support at 3,277.50 now becomes the first line that matters, while 3,440.00 is the near-term ceiling to watch.
The broader range also frames the current move. Shell is trading well below its 3-month high of 3,758.50 and comfortably above its 3-month low of 2,559.50, which is consistent with a market that has corrected but not entered a structural downtrend. In plain language, the stock has room to move either way, but it needs a fresh catalyst to escape the current band.
Oscillators & Momentum
Momentum is mixed, and that is the clearest message from the indicators. The RSI at 56.6 is neutral, so the shares are neither overbought nor oversold; that usually indicates the market is waiting for direction rather than already stretched. The Stochastic %K at 57.3 and %D at 64.0 also sit in neutral territory, but the %K below %D hints that short-term momentum is easing rather than accelerating.
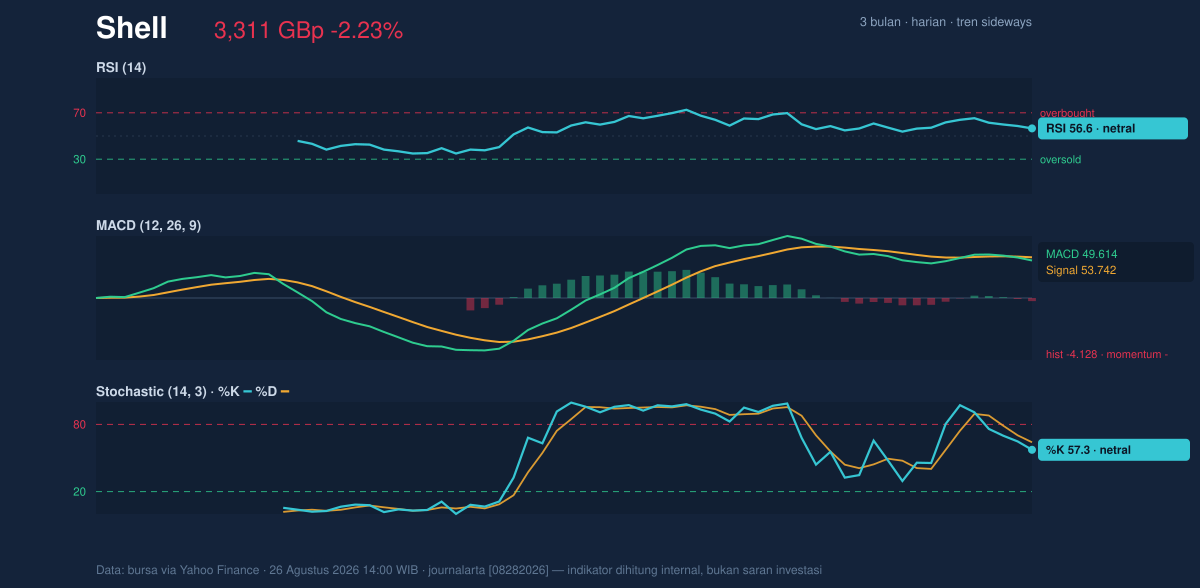
The more cautionary signal comes from MACD at 49.614 versus its signal line at 53.742, with a histogram of -4.128. For general readers, MACD is a trend-following gauge: when it sits below the signal line and the histogram is negative, it suggests recent price action is losing pace. That does not automatically mean a reversal is underway, but it does mean the latest bounce attempts lack conviction.
Taken together, the oscillators do not yet point to panic selling, but they do show that the stock is not building bullish momentum either. The market is neutral on the surface and slightly negative underneath.
Volatility & Volume
Volatility is not extreme, but it is not sleepy either. Shell’s ATR(14) of 52.79 equals 1.6% of the share price, which indicates a moderate daily swing range. That kind of reading usually allows for movement without disorder, and in combination with the 5.8% Bollinger Band width, it suggests the stock is in a relatively tight setup that could expand if a catalyst appears.
The Bollinger position is also telling. With price at %B 29%, Shell is trading in the lower part of its recent band, closer to the lower band at 3,253.53 than to the upper band at 3,449.37. As shown in the chart, that placement often reflects pressure on the downside, but the fact that the bands are narrowing points to a squeeze — a technical condition that can precede a sharper move once the market chooses a side.
Volume, however, is not confirming a strong directional break. The latest turnover of 7,043,943 shares is only 0.8× the 20-hour average of 9,209,111, and OBV is falling. That combination matters because price weakness on sub-par volume can mean sellers are present, but not yet forceful enough to create a decisive breakdown. It also means any rebound attempt would ideally need stronger participation to be trusted.
Key Levels & Scenarios
The immediate technical map is fairly clear. 3,277.50 is first support, and a failure there would expose the lower Bollinger band at 3,253.53. If that area gives way, the stock would likely be saying that the current sideways phase is resolving to the downside. On the upside, 3,351.45 is the first reclaim level because it is the 20-day average, and a move through 3,440.00 would be more meaningful since it aligns with the top of the recent range and the upper Bollinger band at 3,449.37.
The key signal to watch is whether Shell can regain the 20-day average with volume. If it cannot, the current structure remains a market that is drifting under short-term pressure while still protected by the longer moving average. If it can, the squeeze in the Bollinger bands suggests room for a faster move than the recent daily change implies.
Technical Verdict: HOLD (wait & see)
HOLD (wait & see)
- Price is below SMA20 at 3,351.45, which shows the short-term trend has not been reclaimed.
- MACD is negative with the histogram at -4.128, so momentum is still leaning weaker even though RSI is neutral.
- Bollinger Bands are narrowing and price sits near the lower half of the band, implying a possible move but not yet a confirmed direction.
Verdict invalidated if price breaks 3,277.50, because that would mean the nearest support has failed and the current range is no longer holding.
- Ideal Entry Range: 3,277.50 to 3,351.45
- Exit Target: 3,440.00 to 3,449.37
- Stop Loss protection: below 3,253.53
For non-traders, that means Shell is not weak enough to alarm, but not strong enough yet to justify confidence. “We’re in the squeeze now,” one market participant could say, “and the next move will tell us who’s really in charge.”
Summary Data Shell
| Last price | 3,311.00 GBp |
| Change 1 day / 5 days / 1 month | -2.23% / -3.20% / -0.38% |
| Trend / MA-cross | sideways / none |
| SMA20 / SMA50 | 3,351.45 / 3,187.57 |
| RSI (14) / Stochastic %K | 56.6 / 57.3 |
| Bollinger %B / ATR | 29% / 52.79 |
| Support / Resistance 20 days | 3,277.50 / 3,440.00 |
| Data as of | 26 Agustus 2026 14:00 WIB |
Track Shell share price daily: live levels, support/resistance and our full Shell analysis history.