Singtel Stock Analysis: Gains 0.45%, Momentum Gains
On Agustus 28, 2026: price 4.51 SGD, trend sideways, RSI 58.1, support 4.25, resistance 4.61. technical analysis of singtel stock. Singtel Stock Analysis —…
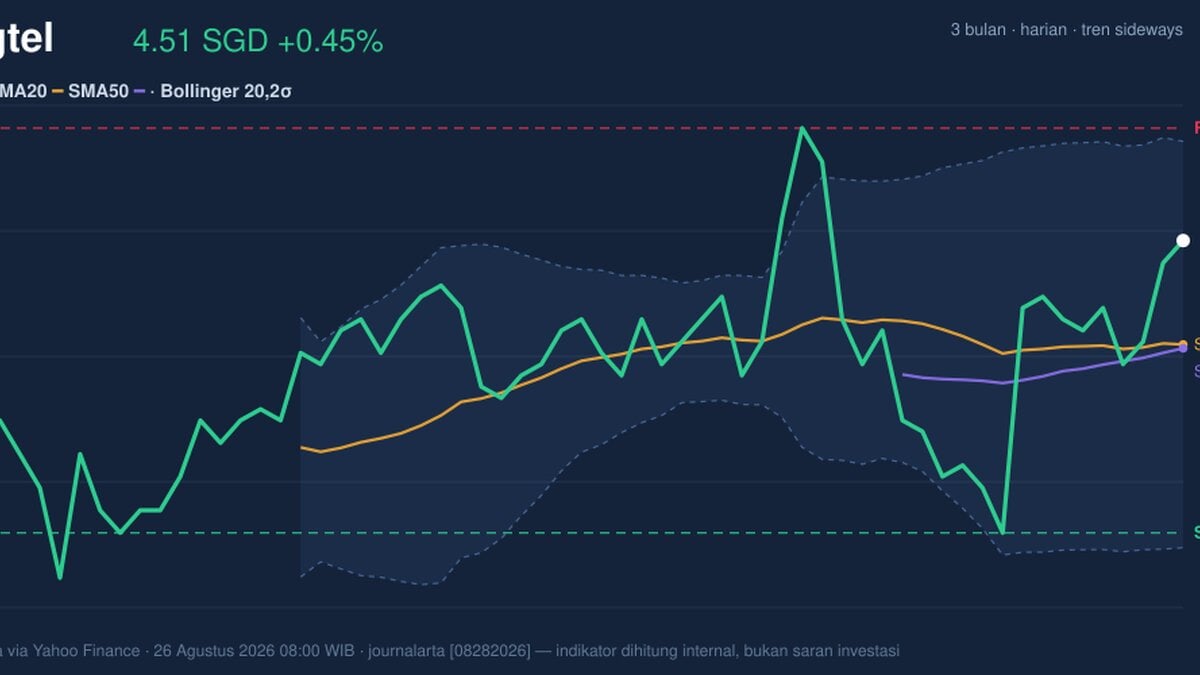
Singapore Telecommunications Ltd. (Singtel) rose to SGD 4.51 on SGX on 26 August 2026, edging up from the previous close of 4.49 as the stock held above its short-term moving averages and stayed within the upper half of its recent trading band. The move is modest, but the signals matter: price is still in a sideways phase, yet the chart shows buyers are willing to defend the stock above the 20-day average, even as momentum gauges begin to look stretched.
Trend & Price Action
The most important signal on the chart is that Singtel is trading above SMA20 at 4.42 and above SMA50 at 4.41, which tells investors the stock is not under immediate technical pressure even though the broader pattern remains sideways. The gap is not wide, so this is not a strong trend breakout; it is more a sign of stability than acceleration.
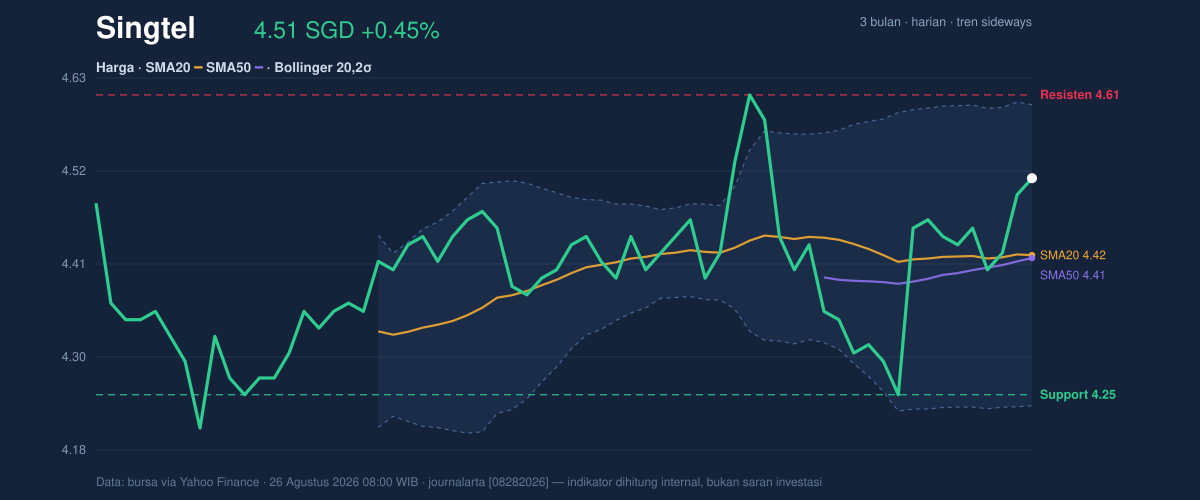
That matters because the price is sitting at 72% of its 20-hour range, closer to resistance than support, with support at 4.25 and resistance at 4.61. In plain language, the stock has already done much of the easy climbing inside the current range, so the next move will need either fresh demand to push through the ceiling or a pause that lets the market reset. The 3-month high of 4.70 is the next broader reference above resistance, while the 3-month low of 4.15 shows where sentiment has previously been willing to absorb more weakness.
Oscillators & Momentum
The momentum picture is mixed, and that is where the chart becomes more interesting. RSI at 58.1 is neutral, which means the stock is not yet in a classic overbought or oversold condition. That is a healthy reading for a sideways name, because it suggests there is still room for price to move without immediately running into a momentum wall.
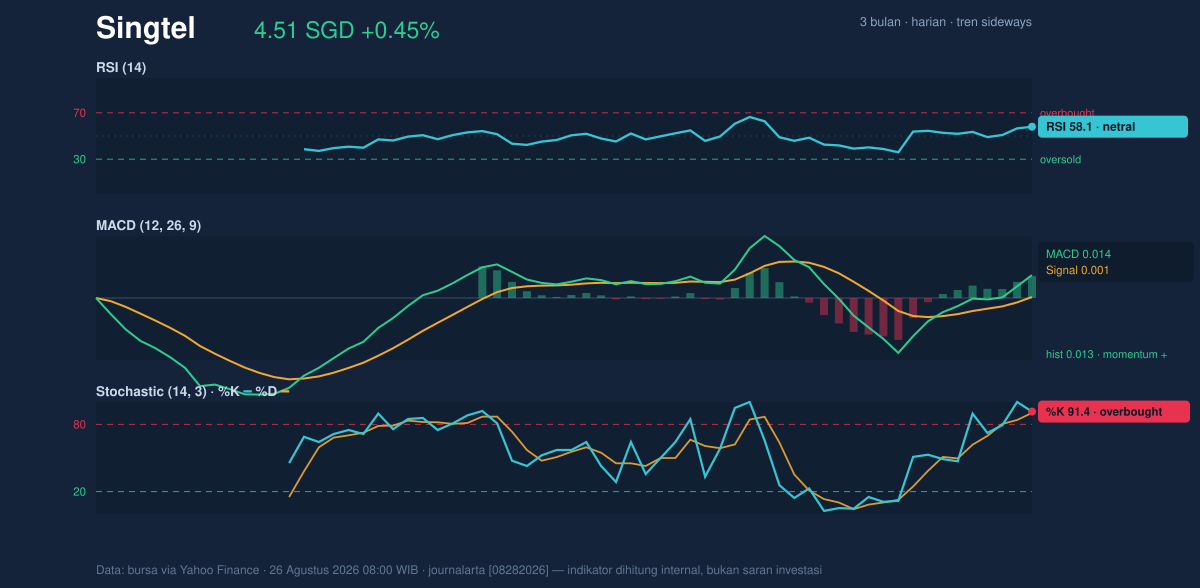
But the faster oscillator is more cautious. Stochastic %K at 91.4 and %D at 90.2 are overbought, which usually means the recent advance has been strong enough to leave price stretched in the short term. This does not automatically signal a reversal, but it often warns that upside may be harder to sustain without a brief consolidation. The key distinction is that overbought is not the same as bearish; it simply means the stock has moved quickly enough that follow-through becomes more selective.
The MACD is positive at 0.014, with the signal line at 0.001 and the histogram at 0.013, so trend momentum is still pointing upward beneath the surface. That combination is important because it shows the recent price strength is not purely random noise. In other words, the stock is not only drifting higher; the shorter-term trend structure is still supporting that move.
Volatility & Volume
Volatility is contained rather than explosive. ATR at 0.08, or 1.7% of price, points to moderate daily movement, while the Bollinger Band width of 8.2% is normal. That combination usually means the market is neither in a squeeze that could precede a sharp expansion nor in a panic phase that would suggest disorderly trading. The stock is operating in a fairly ordinary volatility environment, which often leads to more measured price action.
The Bollinger position also leans constructive but not decisive. With the upper band at 4.60, middle band at 4.42, and lower band at 4.24, Singtel is trading above the midline and below the upper band, with %B at 76%. That tells readers the stock is nearer the upper end of its volatility envelope, but not yet pressing against the top hard enough to confirm a breakout.
Volume adds a useful caution. The latest turnover of 24,388,300 was only 0.8x normal versus the 20-hour average of 30,001,864, so the move higher was not backed by exceptional participation. That matters because a stock can drift up on light volume, but sustained breaks above resistance usually need broader engagement. The one supportive detail is that OBV is rising, which suggests money flow has been improving even if the latest session did not show heavy trading.
Key Levels & Scenarios
The near-term map is clear. 4.25 is the first line of support, and it lines up with the lower part of the recent range. If that floor holds, the stock can keep trading inside the current band and attempt another push toward 4.61, where resistance sits. A clean move above that level would shift attention toward the 3-month high of 4.70, but that would likely require stronger volume than the latest session delivered.
If price fails to hold 4.25, the chart would lose some of its short-term constructive tone and drift back toward the lower Bollinger band at 4.24, then toward the 3-month low of 4.15. That is why the current setup is best read as a range trade with a mild upward bias rather than a confirmed trend breakout.
Technical Verdict: HOLD (wait & see)
HOLD (wait & see) is the clearest read from the current chart because the stock is technically stable above its moving averages, but the short-term momentum is already stretched and volume has not confirmed a breakout.
- Reason 1: Price is above SMA20 at 4.42 and SMA50 at 4.41, which supports the current base but does not yet prove a new trend.
- Reason 2: Stochastic is overbought at 91.4/90.2, suggesting the recent lift may need consolidation before extending further.
- Reason 3: MACD is positive at 0.014 and OBV is rising, so underlying momentum is still constructive even without strong volume confirmation.
- Verdict invalidated if price breaks below 4.25, because that would weaken the current range structure and put the lower Bollinger band and 3-month low back into view.
- Ideal Entry Range: 4.42 to 4.25
- Exit Target: 4.61 to 4.70
- Stop Loss protection: below 4.25
For non-traders, that means the stock is still holding up, but it needs either a stronger push or a cooler pullback before the next move becomes clearer.
Summary Data Singtel
| Last price | 4.51 SGD |
| Change 1 day / 5 days / 1 month | 0.45% / 1.81% / -0.44% |
| Trend / MA-cross | sideways / none |
| SMA20 / SMA50 | 4.42 / 4.41 |
| RSI (14) / Stochastic %K | 58.1 / 91.4 |
| Bollinger %B / ATR | 76% / 0.08 |
| Support / Resistance 20 days | 4.25 / 4.61 |
| Data as of | 26 Agustus 2026 08:00 WIB |
Track Singtel share price daily: live levels, support/resistance and our full Singtel analysis history.