BP Stock Analysis: Drops 1.57%, Testing Support Level
On Agustus 31, 2026: price 514.50 GBp, trend sideways, RSI 44.4, support 514.90, resistance 552.50. technical analysis of bp stock. BP Stock Analysis — full…
BP plc is trading at a point where the market is asking a simple question: is this a pause inside a larger range, or the start of another leg lower? At 514.50 GBp on the London Stock Exchange, the shares are sitting just below the short-term average and close to a support area, while momentum signals remain mixed rather than decisive.
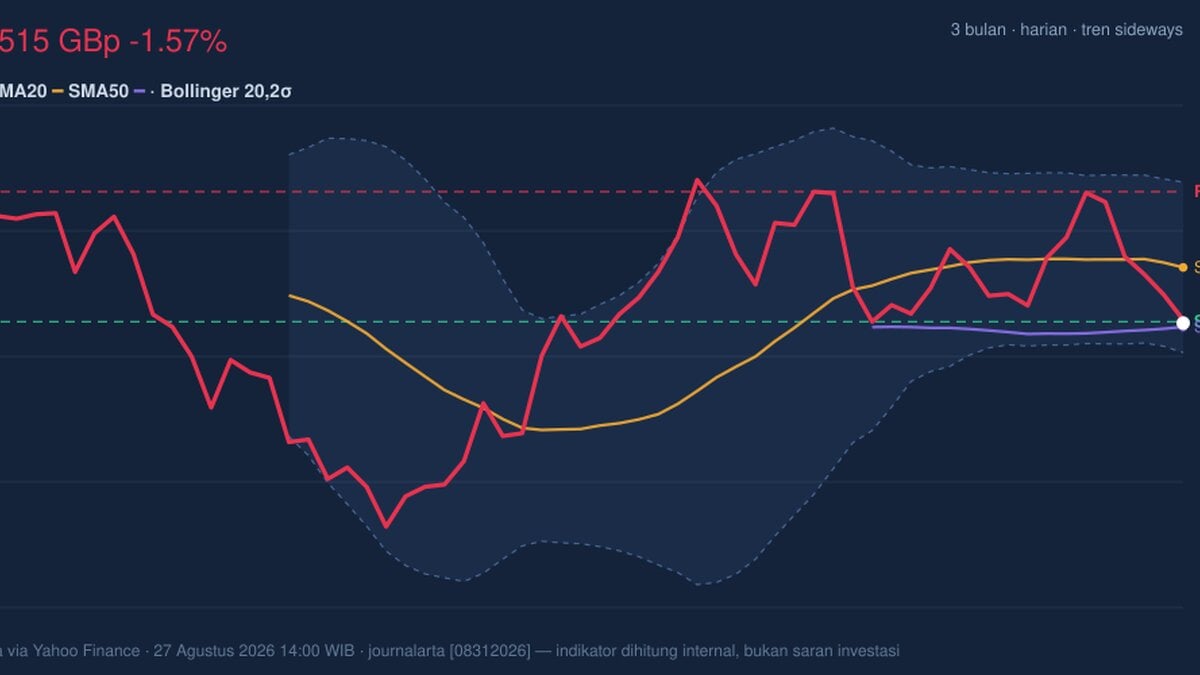
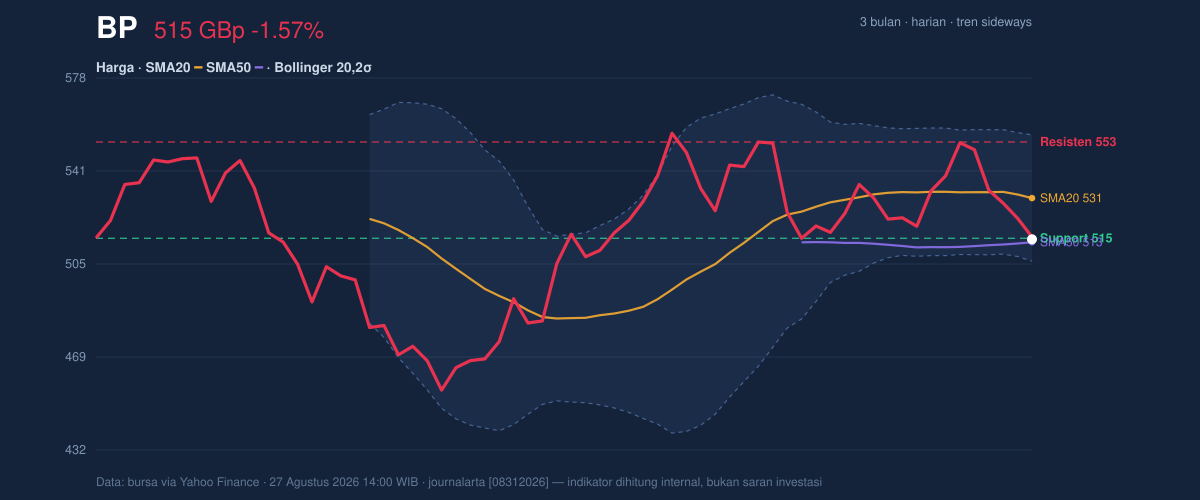
The stock has slipped 1.57% on the day, 6.83% over five days and 5.23% over one month, which tells investors the recent tone has weakened faster than the broader sideways pattern. That matters because price action is not showing a clean trend break yet; instead, BP is still moving in a range, but with the balance of pressure leaning lower. The chart shows the shares below SMA20 at 530.62 and only slightly above SMA50 at 513.36, a setup that often signals a market losing short-term traction while still hovering near a longer reference point. There is no fresh MA-cross, so the moving averages are not delivering a strong trend confirmation in either direction.
Trend & Price Action
As shown in the chart, BP is trading beneath its SMA20, and the SMA20 slope of -0.42% over 5 days suggests the near-term trend is gently downward rather than flat. That is important because a sideways market can look calm, but a falling short average usually means rallies are being sold before they gain momentum. The stock is also positioned in the lower part of its recent trading band: the 20-hour support at 514.90 is effectively being tested, while 20-hour resistance at 552.50 remains far above current levels.
The broader three-month range adds context. BP’s 3-month high is 562.90 and its 3-month low is 450.60. With the current price closer to the lower half of that range than the upper, the market is not pricing in a strong recovery narrative yet. That does not automatically imply further weakness, but it does mean any rebound would need proof, not just hope.
Oscillators & Momentum
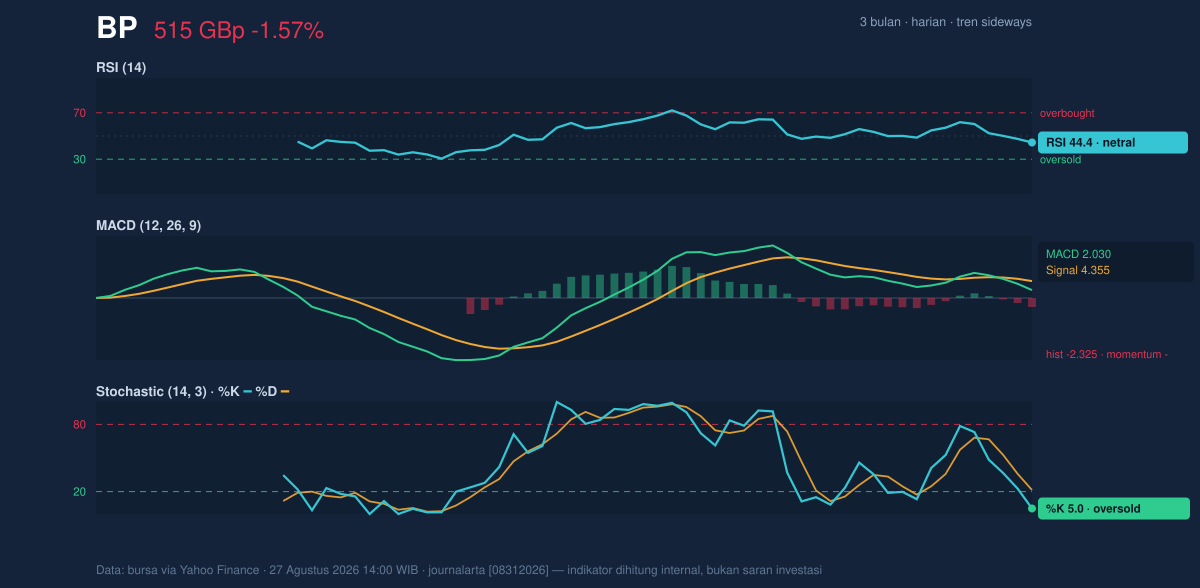
The momentum picture is more nuanced than the price chart alone. RSI at 44.4 is neutral, which means the stock is neither stretched on the upside nor in a classic oversold panic. But the stochastic oscillator is telling a different story: %K at 5.0 and %D at 21.4 place BP in oversold territory. In plain English, that suggests selling has become intense enough that the stock may be vulnerable to a short-term bounce if sellers lose conviction.
That said, the MACD does not yet confirm an upswing. MACD at 2.030 sits below the signal line at 4.355, with a histogram of -2.325. This is a negative momentum reading: the recent price trend is still weaker than the slower trend, and the gap between the two lines shows downward pressure remains in place. So while the stochastic hints at a possible rebound, MACD says the broader momentum has not turned.
Volatility & Volume
Volatility is not elevated enough to suggest a disorderly move, but it is enough to matter. ATR(14) at 12.34, or 2.4% of price, points to moderate daily movement. That usually means the stock can still travel meaningfully in either direction, but not in a panic-driven way. The Bollinger Bands reinforce the same message. BP is near the lower end of the band structure, with %B at 17%, and the bands are relatively contained with a 9.3% width. A low %B means price is near the lower band, often a sign of pressure or a possible mean-reversion setup; the normal band width says this is not a volatility breakout environment yet.
Volume adds an important twist. The latest volume of 31,099,680 is only 0.6× normal versus the 20-session average of 51,413,866. That weak participation matters because a move on light volume is less convincing than one backed by broad trading interest. Yet OBV is rising, which suggests that on balance, accumulation has been creeping in even if the latest session was quiet. In other words, the market is not showing strong conviction, but it is also not showing full-scale distribution.
Key Levels & Scenarios
The immediate technical map is fairly clear. The first line to watch is 514.90 support, which sits just above the current price and is effectively the nearest floor. If BP holds there and recovers, the first meaningful test is SMA20 at 530.62, then the broader 20-hour resistance at 552.50. A move back above the short-term average would matter because it would show the market is willing to reprice the stock back toward the middle of its recent band.
If 514.90 fails decisively, the next reference point is the lower Bollinger band at 505.94. That level is important because a break below the band often signals the market is leaving the calmer part of its range and testing a more bearish phase. The 3-month low at 450.60 is the deeper structural floor on the chart, but the first warning sign would be a loss of the nearer support zone.
Technical Verdict: HOLD (wait & see)
HOLD (wait & see)
- RSI at 44.4 is neutral, so the stock is not oversold enough to confirm a durable rebound, but not weak enough to justify a one-way bearish call.
- Stochastic %K at 5.0 and %D at 21.4 show oversold conditions, yet MACD histogram at -2.325 still confirms negative momentum.
- Price is below SMA20 at 530.62 while hovering near SMA50 at 513.36, which signals indecision rather than a clean trend reversal.
- Verdict invalidated if price falls below 505.94, the lower Bollinger band, because that would suggest downside pressure is broadening rather than stabilising.
- Ideal entry range: 514.90 to 505.94
- Exit target: 530.62, then 552.50
- Stop loss protection: below 505.94
For non-traders, this means BP is sitting in a zone where the market is waiting for proof before choosing direction. The next clue is whether the shares can defend 514.90 or slip through 505.94.
Summary Data BP
| Last price | 514.50 GBp |
| Change 1 day / 5 days / 1 month | -1.57% / -6.83% / -5.23% |
| Trend / MA-cross | sideways / none |
| SMA20 / SMA50 | 530.62 / 513.36 |
| RSI (14) / Stochastic %K | 44.4 / 5.0 |
| Bollinger %B / ATR | 17% / 12.34 |
| Support / Resistance 20 days | 514.90 / 552.50 |
| Data as of | 27 Agustus 2026 14:00 WIB |
Track BP share price daily: live levels, support/resistance and our full BP analysis history.