CVX Stock Gains 0.82%, Momentum Weakens In Focus
On Agustus 31, 2026: price 201.86 USD, trend uptrend, RSI 57.0, support 186.41, resistance 205.77. technical analysis of cvx stock. CVX Stock Gains — full…
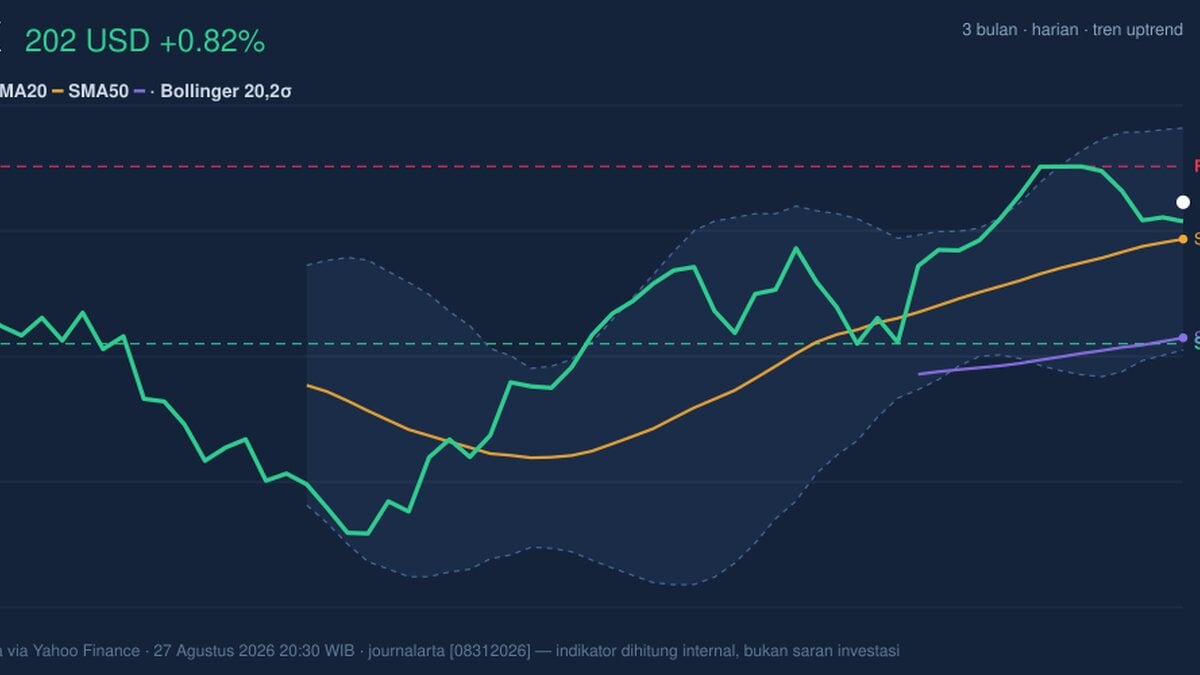
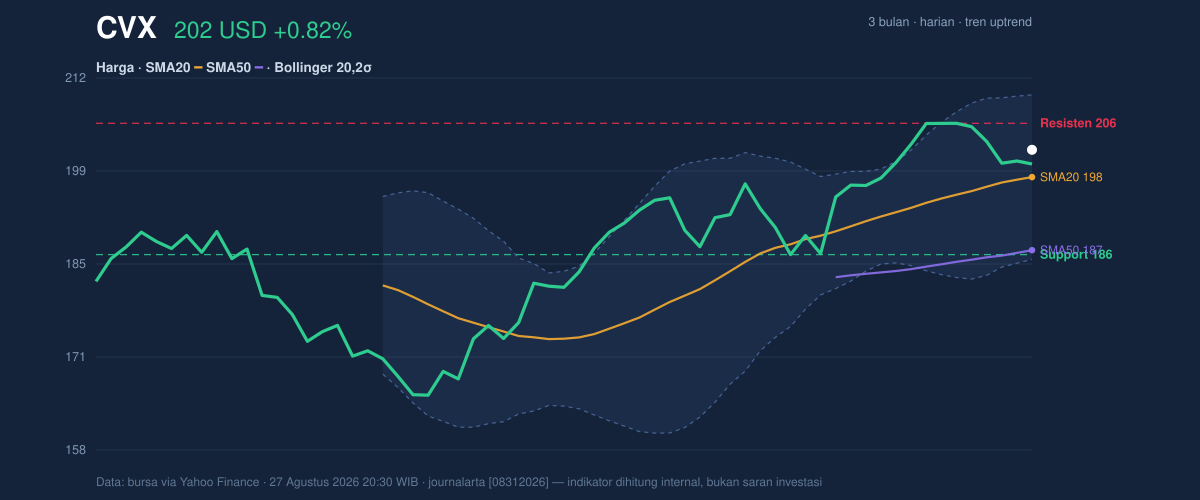
Chevron shares rose to 201.86 USD on the NYSE, up 0.82% from the previous close of 200.21, according to Yahoo Finance data cited on 27 August 2026 at 20:30 WIB. The move keeps CVX in an uptrend, but the stock is now trading close to the upper end of its recent range, which means the market is rewarding the name without yet showing the kind of decisive momentum that usually accompanies a fresh breakout. In plain terms: the trend is still constructive, but the tape is not screaming acceleration.
Trend & Price Action
As shown in the chart, Chevron is holding above its SMA20 at 197.83 and comfortably above its SMA50 at 187.06. That matters because moving averages act like reference lines for trend health: when price sits above both, short- and medium-term buyers are still in control. The SMA20 slope of 1.32% over 5 days reinforces that the near-term trend is rising, but the absence of a new MA-cross suggests this is not a fresh trend ignition; it is more a continuation of an existing one. The stock is also sitting near 80% of its 20-hour range, with 20-hour support at 186.41 and 20-hour resistance at 205.77. That placement tells traders price is leaning toward the upper boundary, where gains often start to meet supply. The 3-month high at 208.98 is now the next meaningful ceiling, while the 3-month low at 164.78 shows how far the stock has already recovered from its prior base.
Chevron is trending up, but it is not yet breaking free.
Oscillators & Momentum
Momentum indicators are more cautious than the price trend. The RSI at 57.0 is neutral, which means the stock is neither stretched nor washed out; it has room to move, but it is not flashing an overbought warning. The Stochastic %K at 54.2 and %D at 59.0 are also neutral, and because %K is below %D, the short-term momentum picture is slightly softer than the price action alone would suggest. The clearest signal comes from the MACD at 3.975 versus the signal line at 4.472, with a histogram of -0.497. That negative histogram means the faster trend line has slipped below its signal line, a classic sign that upward momentum is losing some force even while the broader trend remains intact. In other words, the stock is still rising on structure, but the internal push behind the move has cooled.
This is the kind of setup that often needs confirmation.
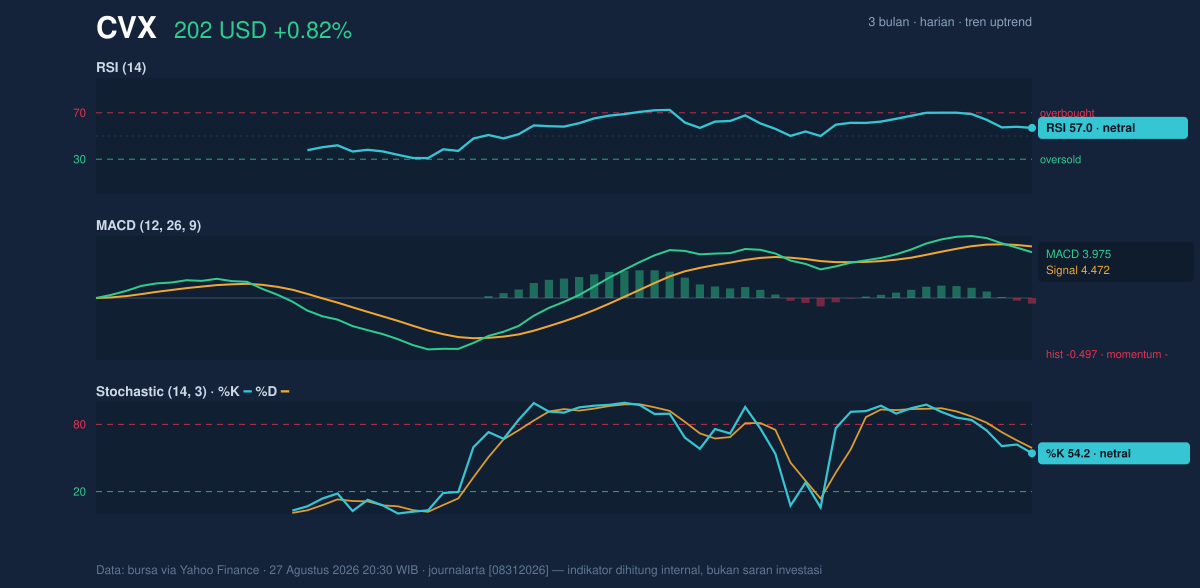
Volatility & Volume
Volatility is moderate rather than extreme. The ATR(14) at 3.86, equal to 1.9% of price, suggests daily swings are present but not disorderly. Meanwhile, the Bollinger Bands show the upper band at 209.95, the middle band at 197.83, and the lower band at 185.72. With %B at 67%, price is trading in the upper portion of the band structure, but not close enough to the top band to imply a stretched condition. The 12.3% band width is described as normal, which means there is no squeeze signaling a pending volatility burst. That matters because breakouts often emerge from compressed bands; here, the market looks more settled, with room to drift rather than explode.
Volume offers mild confirmation rather than conviction. Last volume was 8,112,300 versus a 20-hour average of 8,085,870, essentially 1.0× normal. That is enough to say the move is being accepted, but not enough to argue that institutions are rushing in with unusual force. Still, the OBV is rising, and that is a useful supporting clue: on-balance volume tracks whether trading activity tends to accumulate on up days or down days, so a rising OBV suggests buyers have been doing more of the heavy lifting over time even if the latest session was not exceptional.
Key Levels & Scenarios
The chart leaves Chevron in a fairly clear tactical box. Immediate support at 186.41 sits just below the SMA50 at 187.06, making that zone important as a trend-defense area. If price holds above that band, the broader uptrend stays technically intact. On the upside, resistance at 205.77 is the first obstacle, and above that sits the 3-month high at 208.98. A move through that area would matter because it would push CVX beyond the recent range ceiling and into fresh-high territory for the last three months. If price fails to hold the 197.83 SMA20, the tone would likely shift from constructive to more cautious, since that middle line is currently anchoring the trend. The key signal is not just where price is, but whether it can keep using the moving averages as a floor while momentum stabilizes.
Technical Verdict: HOLD (wait & see)
HOLD (wait & see) — Chevron’s trend is still positive, but the momentum profile is mixed.
- SMA20 and SMA50 support the uptrend, with price above both and the SMA20 slope rising.
- MACD momentum is negative, with the histogram below zero, showing the advance has lost some internal strength.
- RSI and Stochastic are neutral, which does not confirm a breakout or a reversal.
Verdict invalidated if price breaks below 186.41, because that would undercut near-term support and challenge the current trend structure.
- Ideal Entry Range: 186.41 to 197.83
- Exit Target: 205.77 to 208.98
- Stop Loss protection: below 185.72
For non-traders, that means Chevron still looks technically healthy, but the stock needs stronger momentum before the next upward move can be treated as more than just a steady climb.
Next on the calendar, the market will be watching whether CVX can press through 205.77 and then challenge the 208.98 three-month high.
Summary Data CVX
| Last price | 201.86 USD |
| Change 1 day / 5 days / 1 month | 0.82% / -1.90% / 4.97% |
| Trend / MA-cross | uptrend / none |
| SMA20 / SMA50 | 197.83 / 187.06 |
| RSI (14) / Stochastic %K | 57.0 / 54.2 |
| Bollinger %B / ATR | 67% / 3.86 |
| Support / Resistance 20 days | 186.41 / 205.77 |
| Data as of | 27 Agustus 2026 20:30 WIB |
Track CVX stock price daily: live levels, support/resistance and our full CVX analysis history.