Momentum Gains, AstraZeneca Stock Drops 2.16% Today
On Agustus 31, 2026: price 11,970.00 GBp, trend sideways, RSI 47.3, support 11,460.00, resistance 12,632.00. technical analysis of astrazeneca stock.
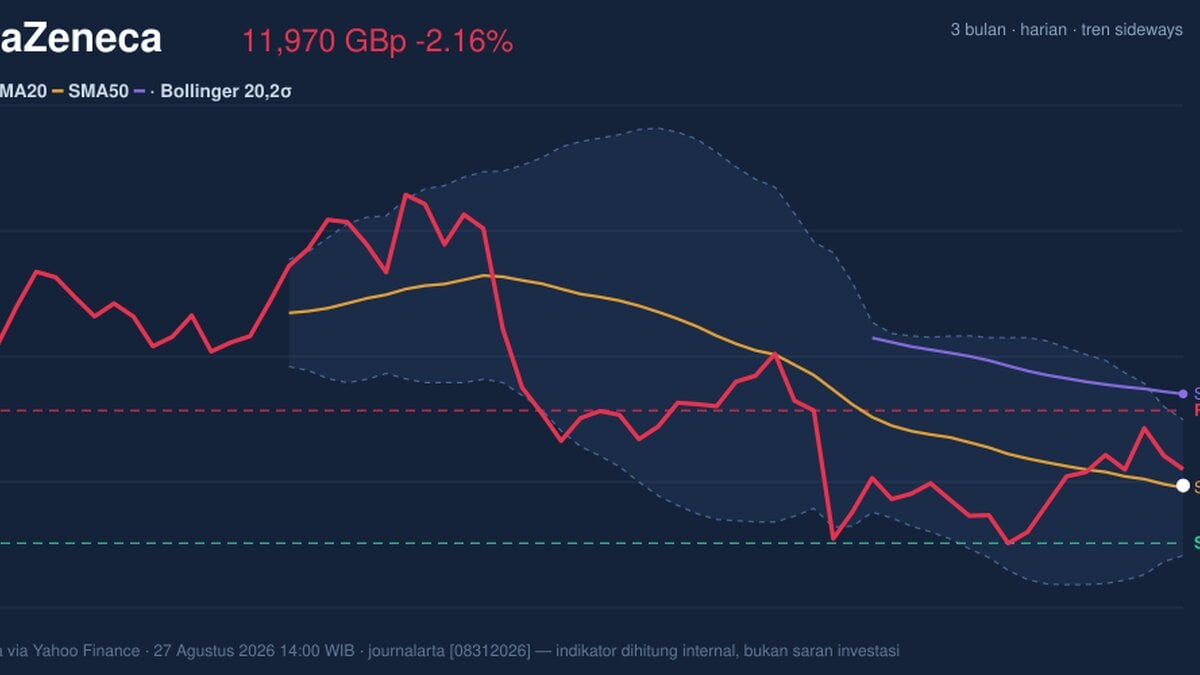
Trading in AstraZeneca shares on the LSE was softer in late-afternoon dealing, with AZN.L last at 11,970.00 GBp, down 2.16% on the day and sitting just above its short-term average, according to Yahoo Finance data via the exchange feed. That positioning matters more than the red day itself: the stock is still holding above the SMA20 at 11,951.80, but it remains below the SMA50 at 12,779.08, which tells traders the medium-term trend has not yet repaired. The chart shows a share price that is not in freefall, but also not convincing enough to call a clean recovery.
Trend & Price Action
As shown in the chart, AstraZeneca is trading in a sideways trend, with the SMA20 sloping down 1.31% over five days. That downward tilt is a quiet warning: even when price is near the short average, the average itself is still easing lower, which usually means sellers have not fully stepped aside. The lack of a fresh MA-cross reinforces that message. In plain terms, there has been no new moving-average crossover to signal a decisive shift in control between short- and longer-term momentum.
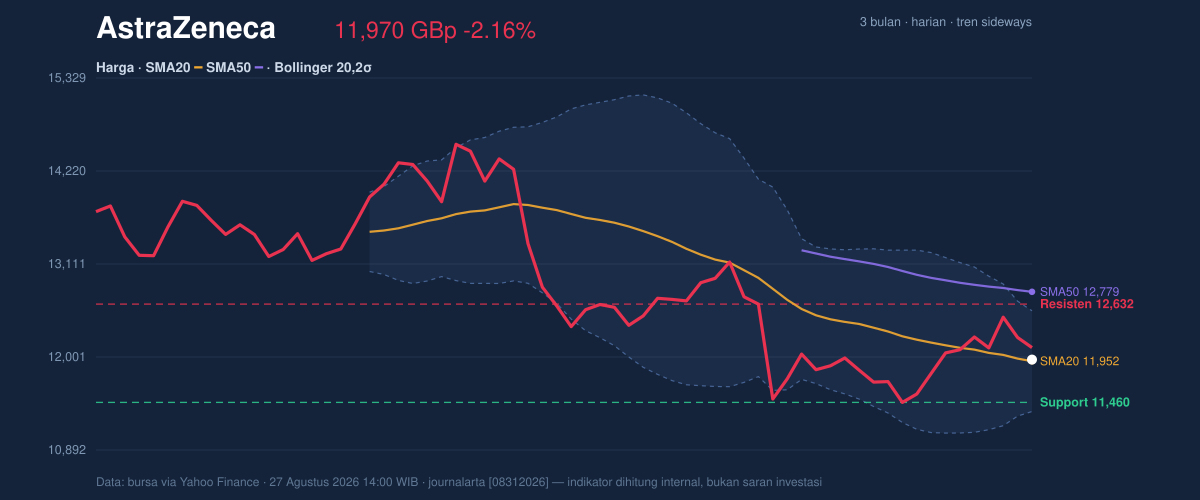
The share price is also sitting in the lower-middle of its recent trading band, at 44% of the 20-day range. That is not weak enough to imply breakdown, but it is not strong enough to suggest buyers have regained command. The stock’s 3-month high of 15,126.00 and 3-month low of 9,892.00 frame the broader volatility envelope: AstraZeneca is well off the peak, yet still materially above the low. This middle positioning usually points to consolidation rather than trend acceleration.
Oscillators & Momentum
The momentum picture is mixed, and that is the key signal. RSI at 47.3 is neutral, which means the stock is neither stretched to the upside nor washed out on the downside. The Stochastic %K at 66.2 versus %D at 81.2 is also neutral, but the gap between the two lines suggests near-term momentum has cooled from a stronger reading. In chart terms, that often means the latest bounce has lost some urgency.
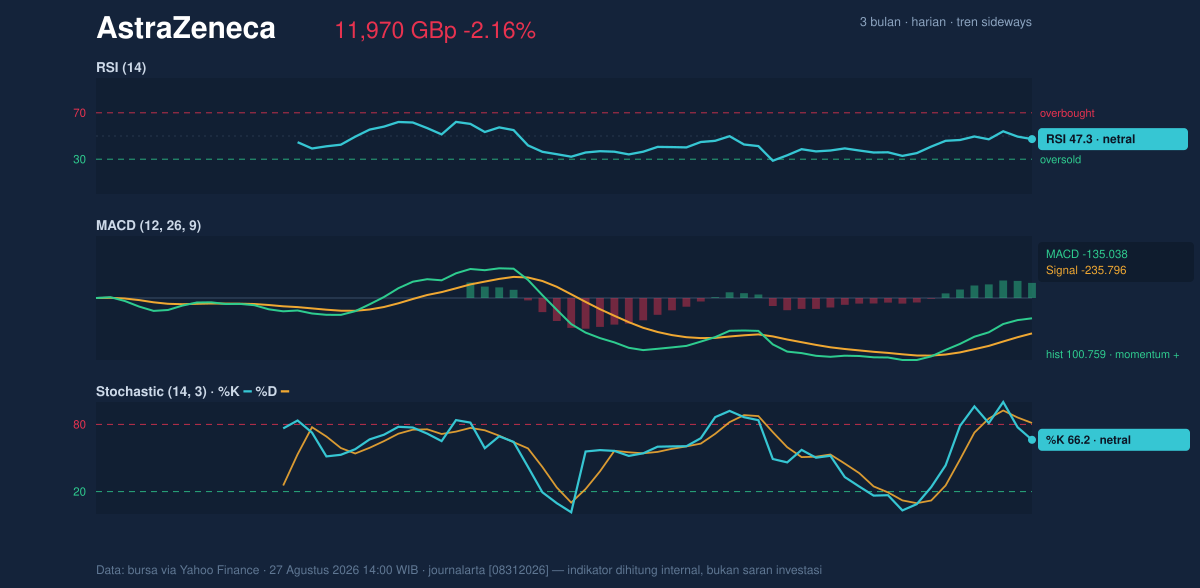
MACD is the more constructive part of the setup. MACD at -135.038 remains below zero, so the trend is still not fully positive, but the histogram at 100.759 is in positive territory and the signal line sits lower at -235.796. That combination usually means downside momentum is fading faster than price is improving. It is an early improvement, not a confirmed breakout signal. For general readers: MACD turning less negative can be the first sign that selling pressure is easing, even before the share price itself looks strong.
Volatility & Volume
Volatility is present, but not extreme. The ATR(14) at 258.65, equal to 2.2% of price, points to moderate daily movement. That matters because it suggests AstraZeneca is still capable of meaningful intraday swings, but not in the kind of disorderly conditions that usually accompany stress events. Bollinger Bands are also sending a steady, rather than urgent, message: the 20-day middle band at 11,951.80 is almost identical to the current price, while the upper band at 12,551.93 and lower band at 11,351.67 define the near-term corridor. With %B at 52% and a 10.0% band width, the stock is sitting close to the centre of its normal volatility range, not at an extreme.
Volume is the one area where caution is warranted. The latest turnover of 3,580,853 is only 0.8x the 20-day average of 4,252,285. That means the latest move lower was not backed by unusually heavy participation, which reduces the conviction behind the decline. At the same time, OBV is rising, and that is an important counter-signal: on-balance volume tracks whether money is, in aggregate, flowing into or out of the stock. A rising OBV while price is drifting sideways often suggests quiet accumulation underneath the surface, even if the chart has not yet broken out.
Key Levels & Scenarios
The nearest important levels are clear. Support at 11,460.00 is the first line to watch, while resistance at 12,632.00 caps the immediate upside. The current price is roughly in the middle of that band, which leaves room for either direction, but not much room for complacency. A move back above the upper Bollinger band at 12,551.93 would strengthen the recovery case because it would place the stock back in the upper part of its recent range and close to resistance. By contrast, a drop through 11,460.00 would weaken the structure and suggest the sideways pattern is giving way to a deeper pullback.
The broader context is also relevant. AstraZeneca is trading below its SMA50 at 12,779.08, so any short-term bounce still has to prove it can reclaim a longer trend marker. Until that happens, rallies are best read as attempts to stabilize rather than evidence of a full trend reversal. The chart, as shown, supports that reading: price is steady, momentum is improving only modestly, and volume is not yet strong enough to confirm a decisive shift.
Technical Verdict: HOLD (wait & see)
HOLD (wait & see) is the clearest technical call from the current setup. The reasons are straightforward: price is above SMA20 but below SMA50, which leaves the trend split between short-term stability and medium-term weakness; MACD histogram is positive, showing momentum is improving, but RSI at 47.3 and Stochastic at 66.2/81.2 remain neutral rather than decisive; and volume is below average at 0.8x, so the latest move lacks strong participation.
- Ideal entry range: 11,951.80 to 12,551.93
- Exit target: 12,632.00
- Stop loss protection: 11,460.00
This means the shares are stabilising, but the chart still needs more proof before the next directional move becomes convincing.
Latest fact: AstraZeneca closed the session with OBV rising even as volume ran at 0.8x the 20-day average.
Summary Data AstraZeneca
| Last price | 11,970.00 GBp |
| Change 1 day / 5 days / 1 month | -2.16% / -0.98% / -5.90% |
| Trend / MA-cross | sideways / none |
| SMA20 / SMA50 | 11,951.80 / 12,779.08 |
| RSI (14) / Stochastic %K | 47.3 / 66.2 |
| Bollinger %B / ATR | 52% / 258.65 |
| Support / Resistance 20 days | 11,460.00 / 12,632.00 |
| Data as of | 27 Agustus 2026 14:00 WIB |
Track AstraZeneca share price daily: live levels, support/resistance and our full AstraZeneca analysis history.