MSFT Stock Gains 3.46%, Testing Key Resistance In Focus
On Agustus 31, 2026: price 513.53 USD, trend uptrend, RSI 69.8, support 464.72, resistance 506.06. technical analysis of msft stock. MSFT Stock Gains — full…
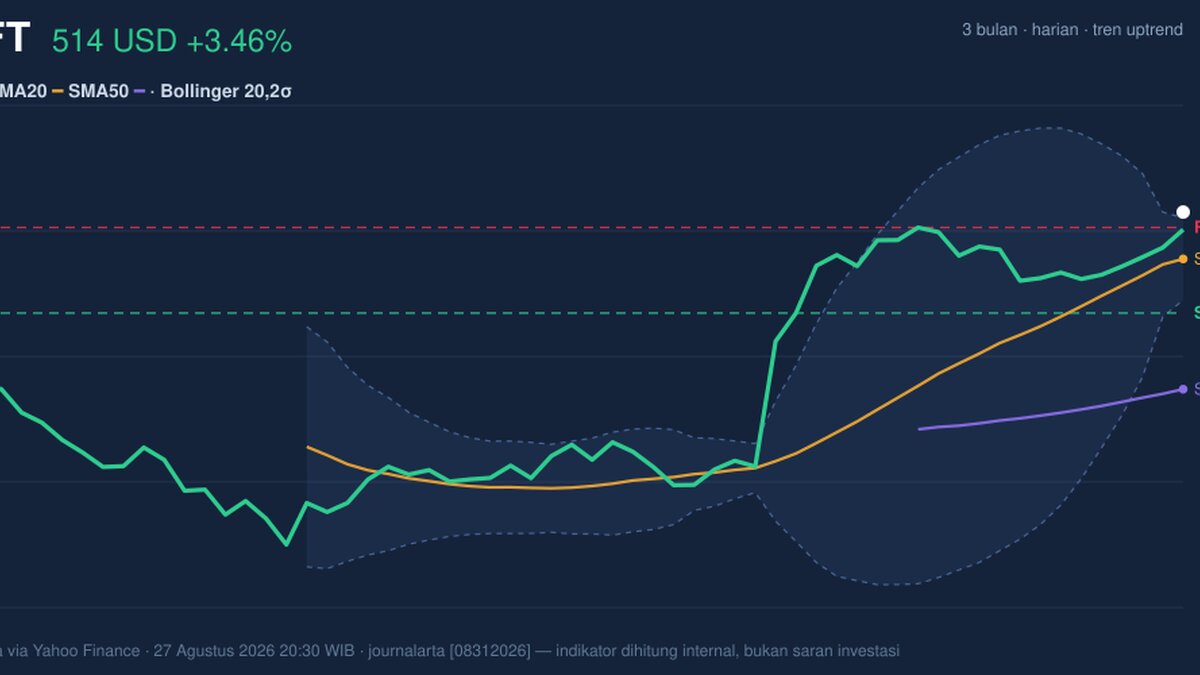
Microsoft climbed on the NASDAQ as MSFT traded at 513.53 USD, up 3.46% on the day, extending a run that has already added 6.73% in five days and 13.84% over one month. It is a clean move, but not a simple one. The stock is pressing into the upper edge of its recent range, and the chart now shows a market that is still in an uptrend while momentum signals are starting to disagree with price.
Trend & Price Action
The broad structure remains constructive. MSFT is trading above its SMA20 at 490.91 and far above its SMA50 at 427.96, which means the medium-term trend is still firmly upward and the longer average is not acting as a ceiling. The SMA20 slope of 4.89% over five days matters because it shows the short-term trend is not just positive, but accelerating.
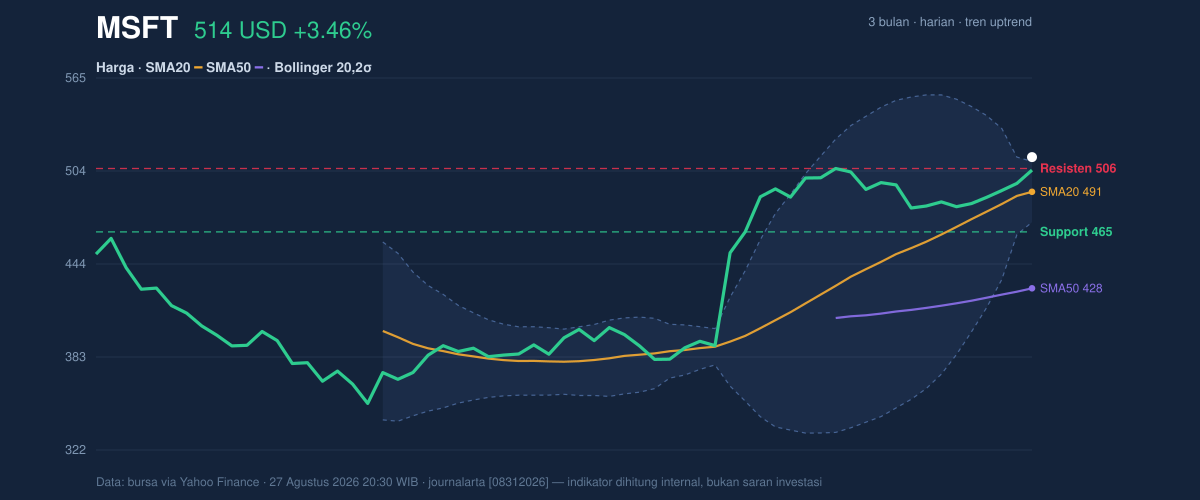
What makes this move more interesting is where price sits inside the recent range. The stock is at 118% of the 20-hour range, with 20-hour resistance at 506.06 now already behind it and three-month high at 513.73 directly overhead. That places MSFT almost exactly at fresh highs, a zone where buyers often remain in control but where the market also becomes more sensitive to profit-taking. In plain terms: the trend is strong, yet the stock is no longer cheap relative to its own recent trading band.
The Bollinger setup reinforces that tension. Price is above the upper Bollinger band at 510.75, with %B at 107%. That usually signals an extension beyond the normal envelope of trading rather than a comfortable base. The band width at 8.1% is normal, not compressed, so this is not a quiet consolidation waiting to break out; it is already a move in motion.
Oscillators & Momentum
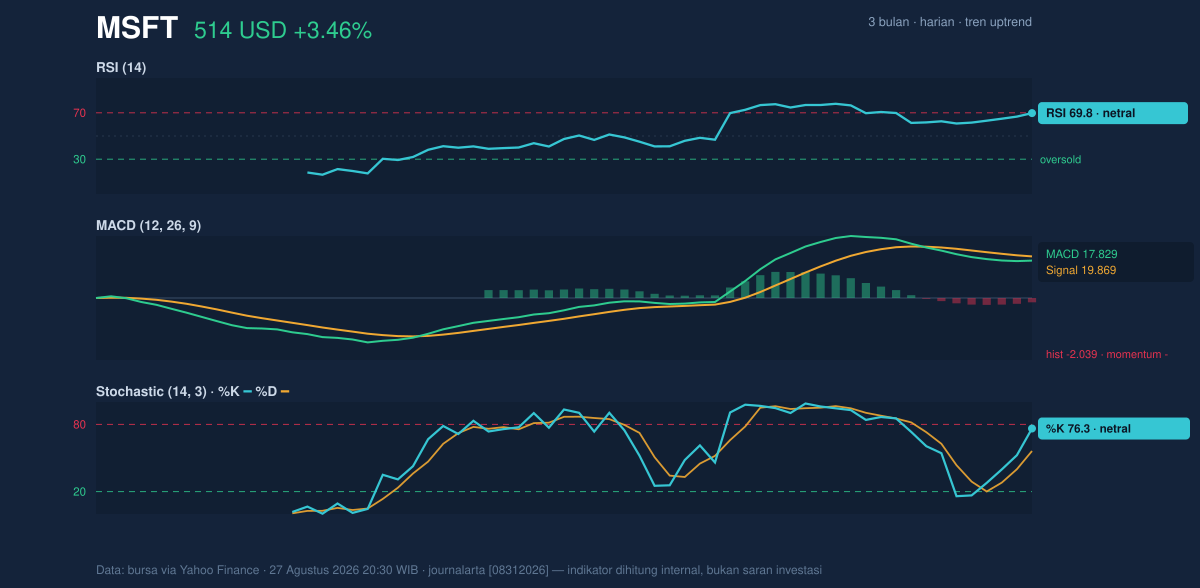
Momentum is where the picture gets less clean. RSI at 69.8 sits just below the classic overbought threshold, which tells readers the stock is stretched but not necessarily exhausted. Stochastic %K at 76.3 and %D at 56.2 point in the same direction: momentum remains elevated, but not in a way that screams fresh breakout confirmation. These oscillators are still supportive of the trend, yet they also warn that the rally is becoming more mature.
The MACD is the key caution flag. MACD at 17.829 is below its signal line at 19.869, and the histogram is -2.039. That combination means the recent pace of upside has slowed even while price has pushed higher. In technical language, price is making progress while the trend engine underneath is losing some thrust. That kind of divergence does not automatically end a rally, but it often explains why advances become choppier near highs.
Volatility & Volume
Volatility is present, but not extreme. ATR at 9.83, or 1.9% of price, suggests the stock can still move meaningfully in a session, yet the environment is not unusually unstable. That matters because when a stock is testing highs with moderate ATR, the next move often depends more on follow-through than on panic.
Volume also supports the advance without making it look euphoric. Last volume was 28,688,800 versus a 20-day average of 30,083,430, or roughly 1.0x normal. That is participation, but not a volume climax. The OBV is rising, which is important because on-balance volume tracks whether money is generally flowing into the stock over time. Rising OBV alongside a price breakout usually means the move has broader sponsorship than a one-day headline spike.
Key Levels & Scenarios
The nearest line in the sand is clear: support at 464.72 is the lower anchor from the 20-hour range, while resistance at 506.06 has now been overtaken and the next visible barrier is the three-month high at 513.73. Because price is already near that high, the market is effectively asking whether it can turn a test into a clean break.
If MSFT can hold above the upper Bollinger band and stay near the recent high, the chart suggests continuation pressure remains intact. If it slips back under 506.06, that would signal the breakout is losing immediate traction and that the move may need to retest the Bollinger middle at 490.91. A deeper fade toward 464.72 would tell traders the rally has moved from extension into correction.
Technical Verdict: HOLD (wait & see)
HOLD (wait & see)
- Trend is positive: price is above SMA20 at 490.91 and SMA50 at 427.96, with the SMA20 slope still rising.
- Momentum is mixed: RSI 69.8 and Stochastic 76.3/56.2 show strength, but MACD 17.829 below signal 19.869 and a -2.039 histogram show fading internal momentum.
- Price is extended: trading above the upper Bollinger band at 510.75 and near the three-month high at 513.73 raises the chance of a pause or retest.
- Verdict invalidated if price falls below 464.72, which would break the current 20-hour support and weaken the near-term structure.
- Ideal Entry Range: 490.91 to 506.06
- Exit Target: 513.73
- Stop Loss protection: 464.72
In plain English: Microsoft is still trending higher, but the chart says the stock is stretched enough that the next move matters more than the last one.
“The rally is intact, but the momentum engine is no longer running at full speed.”
Summary Data MSFT
| Last price | 513.53 USD |
| Change 1 day / 5 days / 1 month | 3.46% / 6.73% / 13.84% |
| Trend / MA-cross | uptrend / none |
| SMA20 / SMA50 | 490.91 / 427.96 |
| RSI (14) / Stochastic %K | 69.8 / 76.3 |
| Bollinger %B / ATR | 107% / 9.83 |
| Support / Resistance 20 days | 464.72 / 506.06 |
| Data as of | 27 Agustus 2026 20:30 WIB |
Track MSFT stock price daily: live levels, support/resistance and our full MSFT analysis history.