ORCL Stock Gains 1.33% Today, Golden Cross Formed
On Agustus 31, 2026: price 150.85 USD, trend uptrend, RSI 56.4, support 129.87, resistance 156.22. technical analysis of orcl stock. ORCL Stock Gains — full…
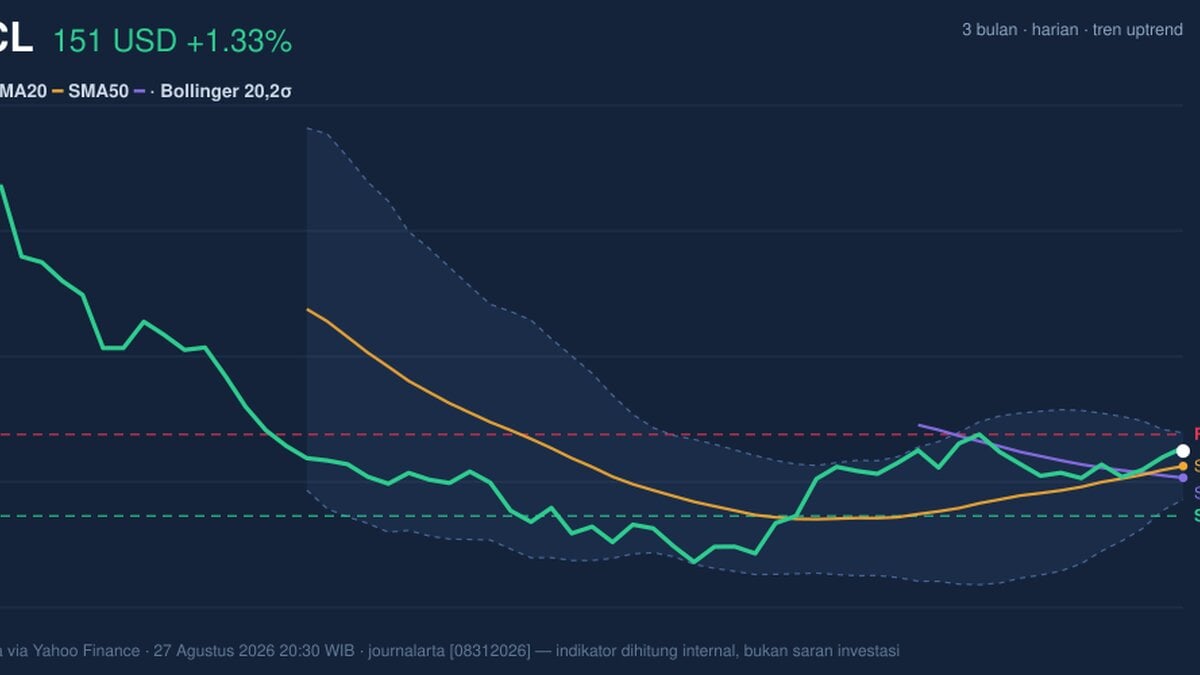
Oracle is pressing toward the upper end of its recent trading range, with the stock at 150.85 USD after a 1.33% daily rise, extending gains to 6.18% over 5 days and 18.26% over 1 month. For international readers, the key point is not just that Oracle is rising, but that the move is now being tested against overhead resistance rather than simply recovering from a low.
Trend & Price Action
The price sits above SMA20 at 145.93 and above SMA50 at 142.20, which matters because both short- and medium-term trend filters are now pointing in the same direction. The chart also shows a golden cross, where the faster 20-day average has moved above the 50-day average. In plain language, that usually signals that recent buying has become strong enough to overtake the slower trend — a constructive shift, though not a guarantee of follow-through.
The stock is also trading near the top of its 20-hour range, with support at 129.87 and resistance at 156.22. Being at roughly 80% of the range means the market has already done much of the recovery work; the next phase now depends on whether buyers can push through the ceiling instead of fading near it.
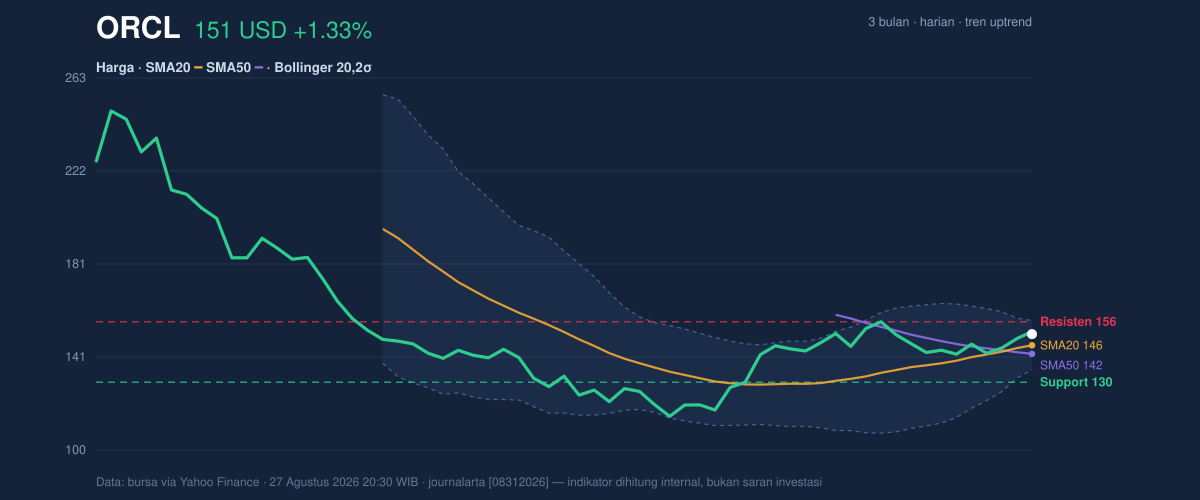
The Bollinger band structure supports that reading. Price is sitting in the upper half of the band, with %B at 73%, which means Oracle is closer to the upper band than the lower band, but not yet at an extreme. The band width is 14.8%, described here as normal, so the market is not in a compressed “coiled spring” state. That reduces the odds of a sudden breakout purely from volatility squeeze, but it also suggests the trend is moving with some order rather than panic.
A short, important line: the trend is constructive, but it is now close to a decision point.
Oscillators & Momentum
The momentum picture is supportive, though not overheated. RSI at 56.4 is neutral, which means the stock is neither stretched into classic overbought territory nor weak enough to suggest exhaustion. That matters because a neutral RSI in an uptrend often indicates the move still has room to continue if buyers stay engaged.
Stochastic readings are also neutral, with %K at 66.5 and %D at 50.8. The gap between the two lines suggests short-term momentum is better than the slower baseline, but not in a runaway condition. In practical terms, this is the kind of setup that can support further gains without screaming “too far, too fast.”
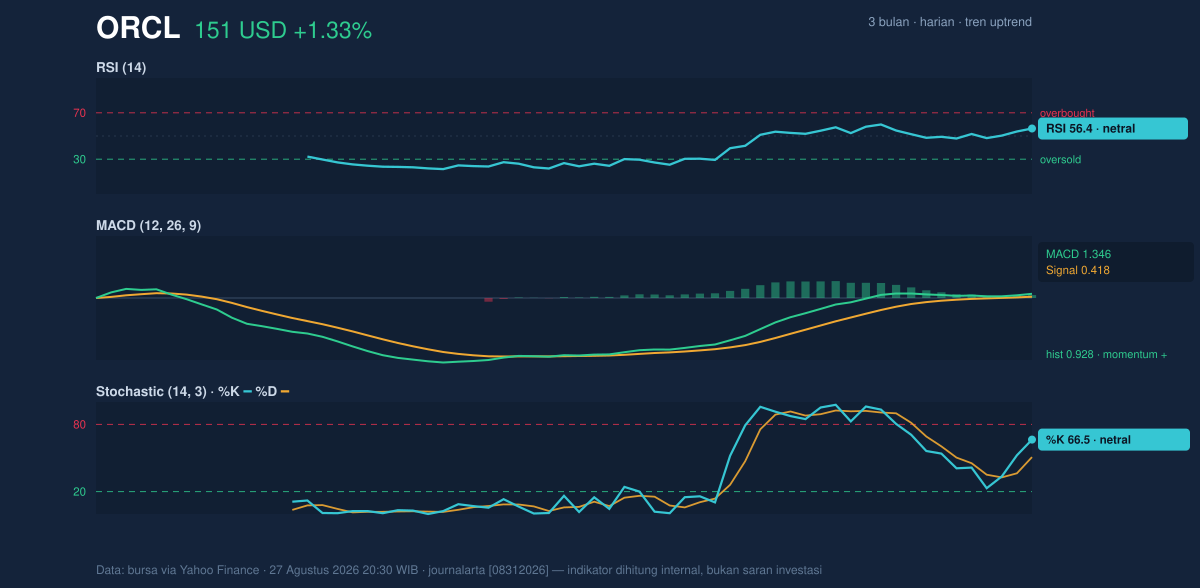
The strongest momentum signal comes from MACD: MACD at 1.346 above the signal line at 0.418, with a histogram of 0.928. That configuration indicates bullish momentum is still positive and the spread is widening enough to show follow-through rather than fading energy. For readers less familiar with the term, MACD is a trend-momentum gauge; when the main line stays above the signal line, it usually means the trend is still being reinforced rather than challenged.
Volatility & Volume
Volatility is not low. ATR at 6.35, or 4.2% of price, signals that Oracle can move materially in either direction over a short period. That matters because when a stock is near resistance, a high ATR can produce either a clean breakout or a sharp rejection. It widens the likely daily swing and makes position management more important than in a quiet market.
Volume gives the move more credibility. Last volume was 30,251,400, above the 20-day average of 25,946,015, or about 1.2× normal. That tells us the recent advance is not happening on thin participation. The OBV is rising, which is another constructive sign: on-balance volume tracks whether trading activity is accumulating on up days or being distributed on down days. Rising OBV alongside price generally suggests buyers are still in control.
The key nuance here is that volume confirms interest, but it has not yet forced a breakout through resistance.
Key Levels & Scenarios
The nearest ceiling remains 156.22, with the Bollinger upper band at 156.70 reinforcing that zone as a likely test area. If price can clear that pocket with continued volume, the chart would be signaling that the current advance is extending beyond the recent range rather than simply probing it.
On the downside, 145.93 — the SMA20 and Bollinger middle band — is the first meaningful pivot. A drop back below that level would suggest the stock is losing short-term trend support and reverting toward a more balanced trading posture. Below that, 142.20 is the next trend filter, and 129.87 is the deeper support that would matter if the move unravels.
The broader context is important: the stock remains far below the 3-month high of 250.25 and well above the 3-month low of 114.50. That wide distance shows Oracle has recovered meaningfully from its lows, but it also reminds readers that the current rally is still operating inside a much larger historical range.
Technical Verdict: HOLD (wait & see)
HOLD (wait & see) is the clearest technical read because the trend is positive, yet price is now approaching resistance where follow-through has not been proven.
- Reason 1: Golden cross + price above SMA20/SMA50 show the trend has turned constructive.
- Reason 2: MACD remains positive, confirming momentum is still aligned with the uptrend.
- Reason 3: RSI and Stochastic are neutral, which leaves room for continuation but does not yet confirm a breakout.
- Verdict invalidated if price breaks below 145.93, because that would mean the stock has fallen back under its short-term trend anchor.
- Ideal entry range: 145.93 to 150.85
- Exit target: 156.22 to 156.70
- Stop loss protection: 142.20, with deeper protection at 129.87
In plain English: Oracle looks healthy, but the chart is asking for proof before the next leg higher can be trusted.
Summary Data ORCL
| Last price | 150.85 USD |
| Change 1 day / 5 days / 1 month | 1.33% / 6.18% / 18.26% |
| Trend / MA-cross | uptrend / golden |
| SMA20 / SMA50 | 145.93 / 142.20 |
| RSI (14) / Stochastic %K | 56.4 / 66.5 |
| Bollinger %B / ATR | 73% / 6.35 |
| Support / Resistance 20 days | 129.87 / 156.22 |
| Data as of | 27 Agustus 2026 20:30 WIB |
Track ORCL stock price daily: live levels, support/resistance and our full ORCL analysis history.