Shell Stock Technicals Today: Drops 0.79%, Momentum Weakens
On Agustus 31, 2026: price 3,344.50 GBp, trend sideways, RSI 49.4, support 3,277.50, resistance 3,440.00. technical analysis of shell stock.
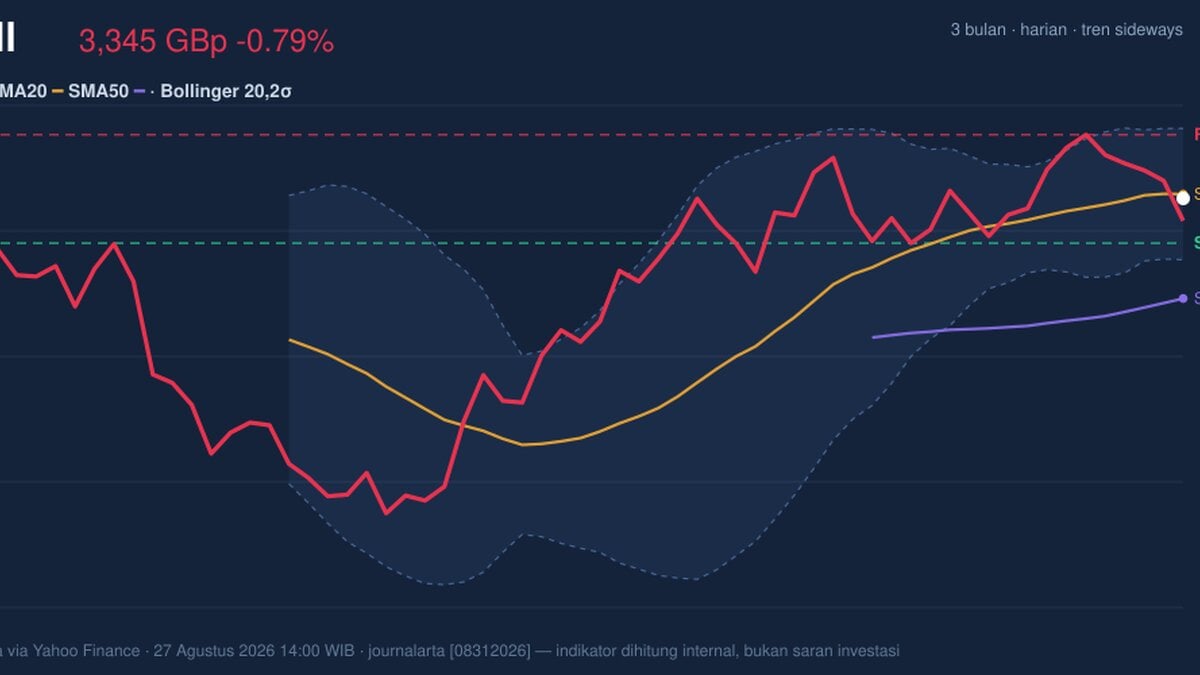
Shell plc’s shares on the LSE slipped to 3,344.50 GBp on 27 August 2026 at 14:00 WIB, edging below the prior close of 3,371.00 and leaving the stock in a narrow technical drift rather than a decisive trend. The move matters less for its size than for what it says about positioning: Shell is trading just under its short-term average, momentum is soft, and volume is not strong enough to suggest fresh conviction from the market.
Trend & Price Action
The broader pattern is still sideways, which is important because it tells readers the stock has not yet chosen a clear direction despite recent swings. The price sits below SMA20 at 3,351.05 but above SMA50 at 3,194.55, a setup that usually signals a market stuck between short-term hesitation and medium-term support. In plain language, buyers have not lost control of the larger structure, but they are no longer pressing the stock higher with force.
That tension is visible in the range position. Shell is trading at 41% of the 20-hour range, closer to the lower half than the top, while the 20-hour support at 3,277.50 and resistance at 3,440.00 frame the current battle line. The stock also remains well below the 3-month high of 3,758.50 and comfortably above the 3-month low of 2,559.50, which reinforces the idea of consolidation rather than trend acceleration.
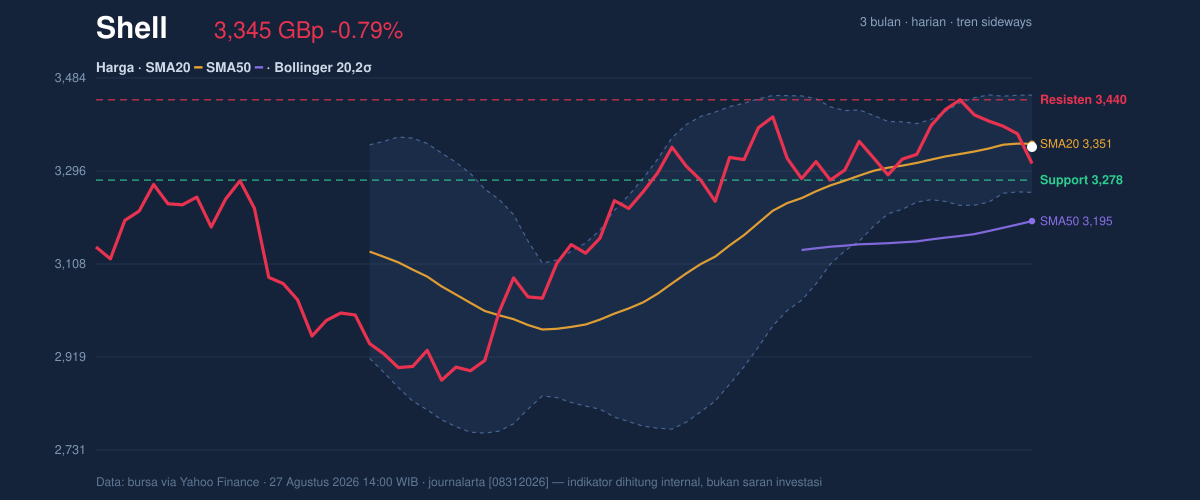
The Bollinger structure adds a useful signal here. The bands are relatively tight, with a 5.9% width, and that narrowing often points to a compression phase where price can move sharply once it escapes the banded range. Because Shell is sitting near the middle band at 3,351.05 and the %B is 47%, the chart is not showing a stretched or overheated condition; it is showing indecision. That is a calm-looking setup on the surface, but squeeze conditions can turn quickly.
Oscillators & Momentum
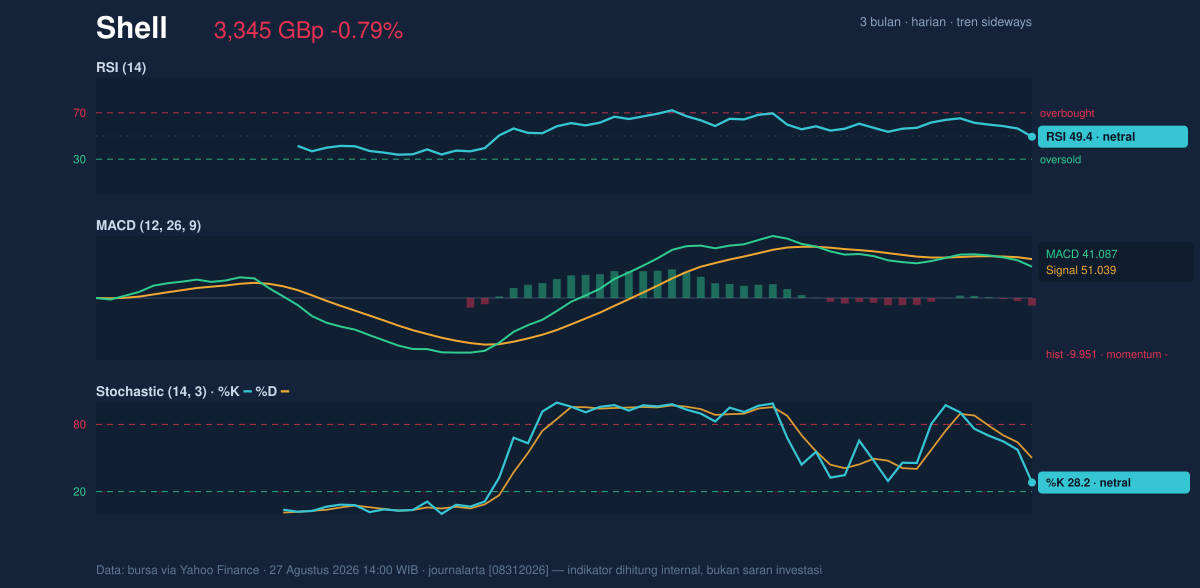
The momentum picture is mixed, and that is the most important takeaway. RSI at 49.4 is neutral, which means the stock is neither overbought nor oversold and has room to move in either direction. But neutrality alone is not enough to offset the other signals: Stochastic %K at 28.2 versus %D at 50.1 shows short-term momentum has weakened and is sitting in the lower band of its recent range, while the MACD at 41.087 remains below the signal line at 51.039 with a -9.951 histogram. That combination usually means the recent price path still has downward bias, even if the longer trend has not broken.
Put simply, RSI says “not extreme,” Stochastic says “short-term weak,” and MACD says “momentum is still negative.” When those three are not aligned, the market often needs a catalyst before it commits. The chart below helps show why this matters: the stock is not oversold enough to imply an automatic rebound, but it is also not strong enough to confirm a clean breakout.
Volatility & Volume
Volume is not helping the bulls. The latest turnover of 8,156,409 shares is below the 20-hour average of 9,096,005, or about 0.9× normal, which suggests the latest move lower came without heavy participation. That can mean selling pressure is not yet broad or urgent, but it also means there is not enough demand to overpower it. The OBV is falling, and that is a subtle but useful warning: on-balance volume tracks whether money is flowing into or out of a stock, and a decline there often confirms that price weakness has support from participation, even if the headline move is modest.
Volatility is moderate. The ATR(14) at 53.18, equal to 1.6% of price, says daily movement is present but not excessive. Combined with the narrow Bollinger squeeze, that sets up a market that could stay quiet for a bit and then expand quickly if a level gives way. In other words, the chart is compressed, not calm in a durable sense.
Key Levels & Scenarios
The immediate map is straightforward. 3,277.50 is the key support to watch, while 3,440.00 is the first resistance that needs to be reclaimed for the tone to improve. The price is currently below the short-term average but still above the medium-term average, so the market is effectively testing whether the recent softness is just noise or the start of a deeper pullback.
If Shell holds above 3,277.50 and pushes back through 3,351.05, the chart would begin to look less fragile, especially if volume improves and MACD starts narrowing its gap. If it fails to hold 3,277.50, the next signal would be that the squeeze is resolving to the downside, with the stock vulnerable to a move toward the lower Bollinger band at 3,252.54. The current setup therefore leans on support more than it celebrates strength.
Technical Verdict: HOLD (wait & see)
Shell’s chart is not weak enough for a bearish breakdown call, but it is not strong enough to justify a bullish confirmation either. The verdict rests on three signals: price below SMA20 shows short-term hesitation, MACD below signal line keeps momentum negative, and volume below average with falling OBV suggests the latest move lacks constructive participation. The verdict is invalidated if price breaks 3,277.50, because that would confirm the current support has failed.
- Ideal Entry Range: 3,277.50 to 3,351.05
- Exit Target: 3,440.00
- Stop Loss protection: below 3,252.54
For non-traders, this means Shell is sitting in a wait-and-see zone: the stock needs to prove it can hold support and regain short-term momentum before the chart looks healthier. “The market is not giving a clear answer yet, and that uncertainty is exactly what makes the next move matter.”
Summary Data Shell
| Last price | 3,344.50 GBp |
| Change 1 day / 5 days / 1 month | -0.79% / -2.78% / 0.77% |
| Trend / MA-cross | sideways / none |
| SMA20 / SMA50 | 3,351.05 / 3,194.55 |
| RSI (14) / Stochastic %K | 49.4 / 28.2 |
| Bollinger %B / ATR | 47% / 53.18 |
| Support / Resistance 20 days | 3,277.50 / 3,440.00 |
| Data as of | 27 Agustus 2026 14:00 WIB |
Track Shell share price daily: live levels, support/resistance and our full Shell analysis history.