T Stock Gains 0.54% Today, Testing Key Resistance
On Agustus 31, 2026: price 26.01 USD, trend uptrend, RSI 63.6, support 23.06, resistance 25.87. technical analysis of t stock. Stock Gains — full details here.
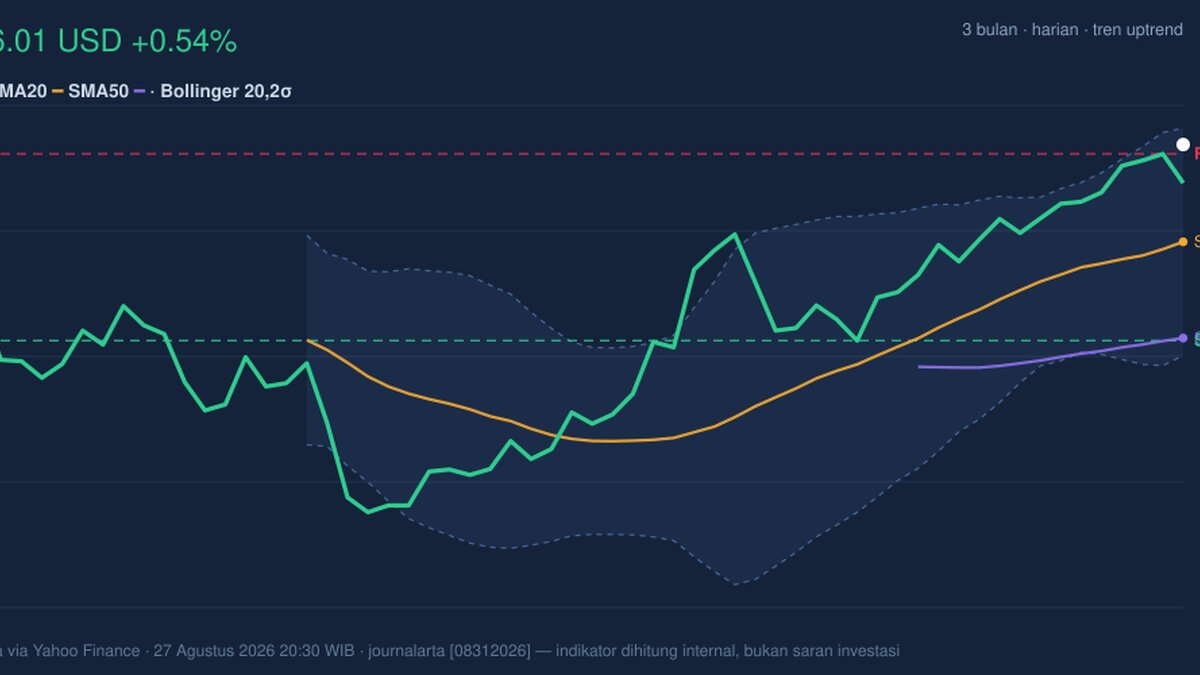
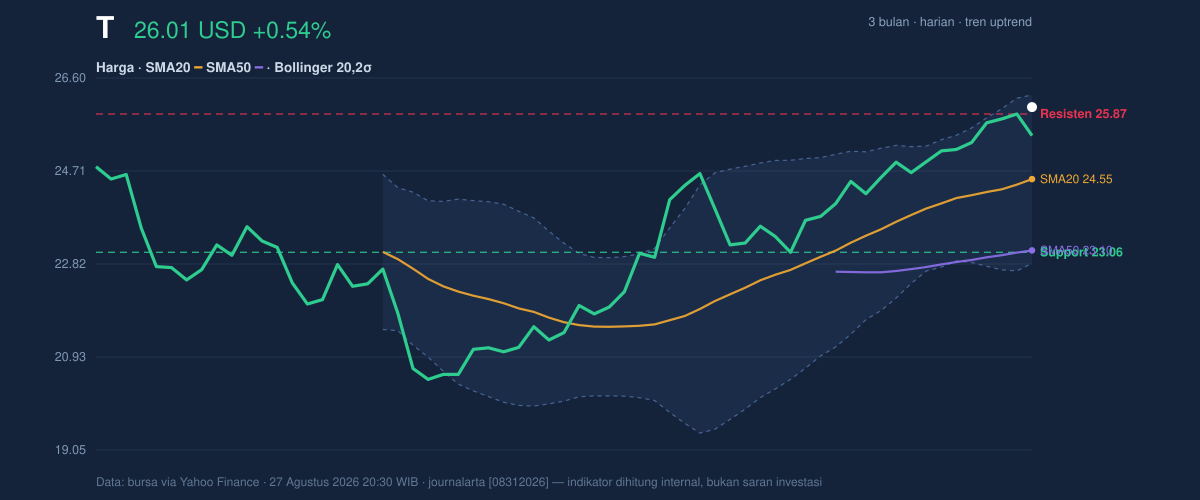
AT&T (T) closed at 26.01 USD, just below its 3-month high of 26.02 and a hair under the Bollinger upper band at 26.26. That matters because the stock is not merely rising; it is pressing against the top of its recent range while technical momentum remains constructive. The move has been steady rather than frantic: 1 day 0.54%, 5 days 3.42%, and 1 month 12.06%, which points to a market that is still willing to pay up for the shares without showing the kind of spike that usually ends a move quickly.
Trend & Price Action
The broader structure is still pointing higher. AT&T is in an uptrend, with the SMA20 at 24.55 and the SMA50 at 23.10, leaving price comfortably above both trend markers. In plain terms, the stock is trading above its short- and medium-term averages, which usually means recent buyers are in control and pullbacks have so far been absorbed rather than extended. The SMA20 slope of 1.59% over 5 days reinforces that the short-term trend is not flattening out.
There is no fresh moving-average crossover to point to, so the message comes from positioning rather than a dramatic technical event. That often makes the trend more durable: the stock has already been trending higher, and the market is now testing whether that move can continue without a new catalyst. As shown in the chart, price is also trading at 105% of the 20-hour range, with 20-hour support at 23.06 and 20-hour resistance at 25.87. The fact that price has moved beyond that resistance and is sitting near the range ceiling tells readers the prior cap has been absorbed, but also that upside room is now narrower unless fresh demand appears.
Oscillators & Momentum
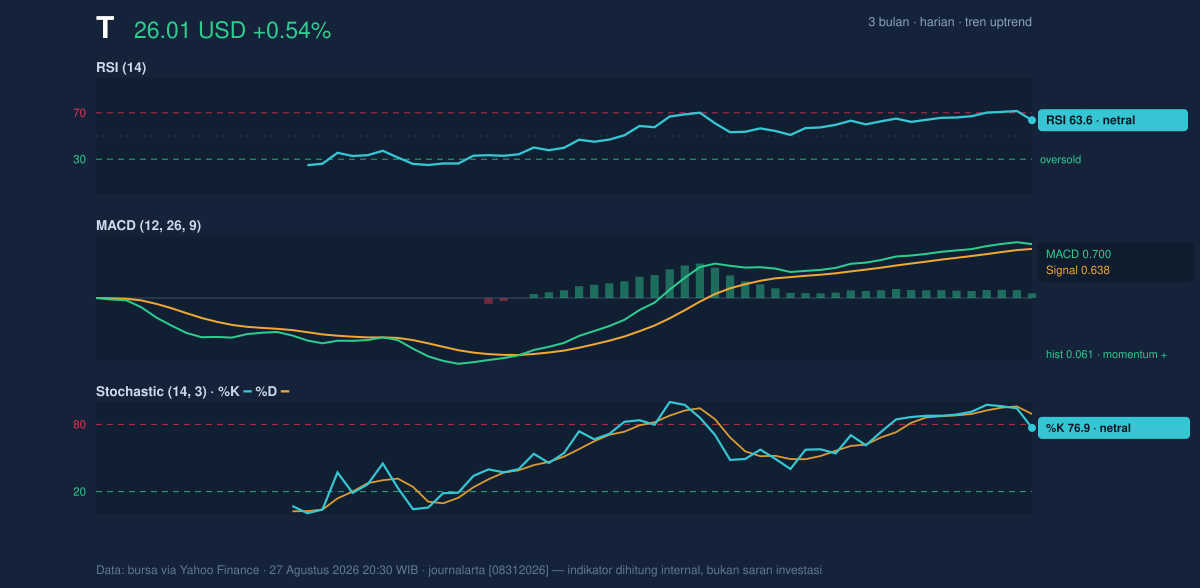
The momentum picture is positive, but not euphoric. RSI(14) at 63.6 sits in neutral territory, which means the stock is not yet in the classic overbought zone even after the recent run. That is important: a neutral RSI during a strong price advance suggests the rally has not fully exhausted itself. At the same time, the oscillator is close enough to the upper end of its range to show that enthusiasm is building.
Stochastic %K at 76.9 and %D at 89.2 are also in neutral territory, but with %K below %D, the short-term pace appears a bit less forceful than the recent peak. That does not automatically signal reversal; it more often means the move is consolidating after an extended push. The more decisive clue is the MACD at 0.700 above its signal line at 0.638, with a positive histogram of 0.061. In technical terms, MACD above signal line indicates that upward momentum is still dominating, even if the gap is not wide. As shown in the chart, the oscillators are aligned with the trend, but they are no longer screaming acceleration.
Volatility & Volume
Bollinger Bands are in a normal-width regime at 13.9%, so the market is not pricing in an unusually large breakout or breakdown. That matters because a normal band width often means price can continue to drift within a controlled trend rather than whipsaw violently. With %B at 93%, AT&T is trading very near the top of the band structure, which signals strength but also tells traders that the stock is extended relative to its recent average. In practical terms, the market is close to a short-term ceiling even though the broader trend remains firm.
ATR(14) at 0.46, or 1.8% of price, suggests volatility is moderate. That is consistent with a defensive large-cap name: moves are measurable, but not disorderly. Volume complicates the picture a little. The latest print of 26,110,900 is only 0.7x the 20-hour average of 37,716,935, so the latest advance is not being confirmed by heavy participation. Yet OBV is rising, which means the cumulative volume trend still favors accumulation over distribution. In other words, the tape is not showing panic buying, but it is also not showing broad selling pressure.
Key Levels & Scenarios
The immediate upside reference is the 26.26 Bollinger upper band, followed by the 3-month high at 26.02, which has already been matched and slightly exceeded on a closing basis. The nearest downside reference is the 20-hour resistance-turned-support at 25.87, then the broader SMA20 at 24.55. Below that, the 20-hour support at 23.06 becomes the deeper line in the sand. Because price is already near the top of the range, the next move is less about discovering direction and more about whether the stock can hold above the former ceiling.
If price stays above 25.87 and continues to respect the 24.55 SMA20, the chart remains in a constructive posture. If it slips back below the Bollinger midline at 24.55, that would suggest the recent push is losing momentum and reverting toward the middle of the range. A break under 23.06 would do more serious damage to the current bullish structure, because it would place price back inside the lower half of the recent trading band.
Technical Verdict: HOLD (wait & see)
HOLD (wait & see) because the trend is still positive, but the stock is now stretched near the top of its band and close to its recent high, while volume has not expanded to confirm a fresh breakout. MACD remains above signal, price is above the SMA20 and SMA50, and OBV is rising, which are all supportive. But %B at 93% and price near 26.26 mean the easy part of the move may already be behind it unless participation improves.
- Ideal Entry Range: 24.55 to 25.87
- Exit Target: 26.26
- Stop Loss protection: 23.06
This means the chart is still healthy, but it is asking for confirmation before the next leg.
Verdict invalidated if price breaks below 23.06.
For non-traders: AT&T looks technically firm, but it is already near the top of its recent trading range, so the chart is saying “strong, but not cheap on momentum.”
Summary Data T
| Last price | 26.01 USD |
| Change 1 day / 5 days / 1 month | 0.54% / 3.42% / 12.06% |
| Trend / MA-cross | uptrend / none |
| SMA20 / SMA50 | 24.55 / 23.10 |
| RSI (14) / Stochastic %K | 63.6 / 76.9 |
| Bollinger %B / ATR | 93% / 0.46 |
| Support / Resistance 20 days | 23.06 / 25.87 |
| Data as of | 27 Agustus 2026 20:30 WIB |
Track T stock price daily: live levels, support/resistance and our full T analysis history.