Testing Key Resistance, ADBE Stock Gains 6.60% Today
On Agustus 31, 2026: price 291.52 USD, trend uptrend, RSI 67.4, support 250.41, resistance 289.15. technical analysis of adbe stock. Testing Key Resistance —…
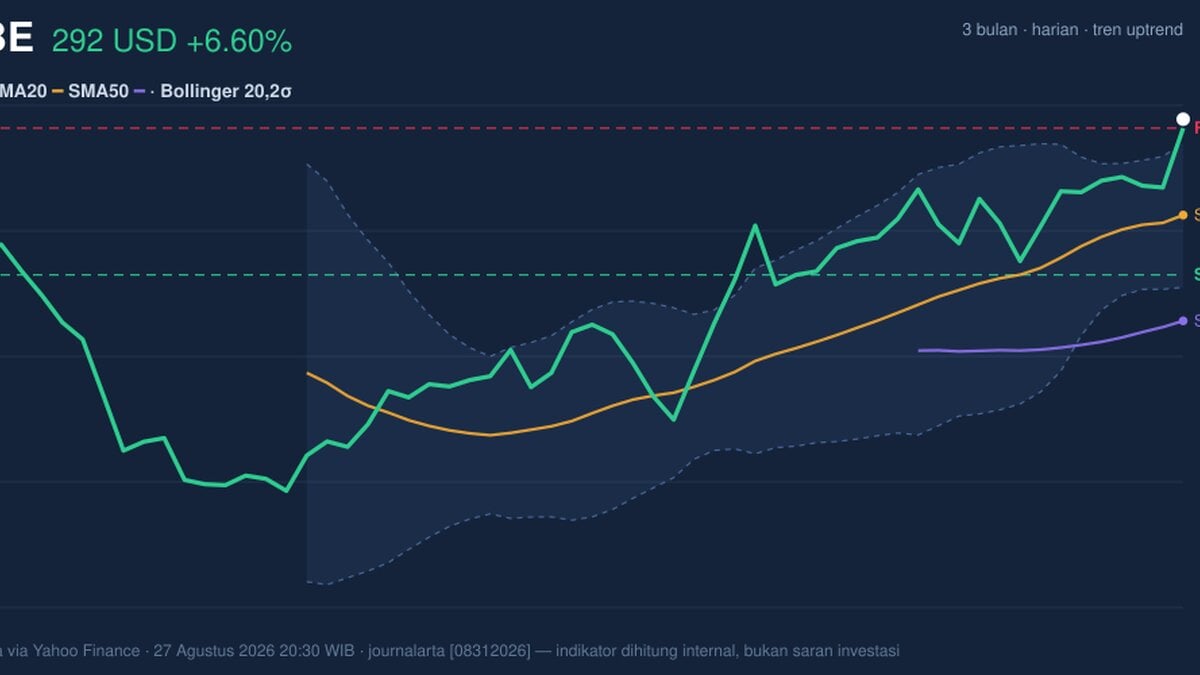
Adobe Inc. rose to 291.52 USD on Nasdaq, extending a move that has pushed the stock 6.60% higher in one day and 17.60% over one month, according to Yahoo Finance data as of 27 August 2026 20:30 WIB. The price is now trading above the SMA20 at 266.20 and well above the SMA50 at 238.27, a setup that usually tells investors the medium-term trend has not just turned positive, but has also begun to attract momentum traders who tend to chase strength rather than wait for pullbacks. The catch is that the move has already stretched into the upper edge of its recent range, with the stock sitting near its 3-month high of 291.18 and above the upper Bollinger band. That means the market is still rewarding buyers, but it is also starting to demand proof that the breakout can hold.
Trend & Price Action
The chart shows a stock that has moved decisively out of its prior base, with the uptrend reinforced by the SMA20 slope of 3.19% over 5 days. That slope matters because it signals the average price itself is rising quickly, not merely that the stock had one strong session. With price above both the SMA20 and SMA50, the trend structure remains constructive, and the lack of a new MA-cross means this is not a fresh crossover story so much as a continuation of an already-established advance. In plain language: the stock is not waiting for permission to trend higher; it is already doing so.
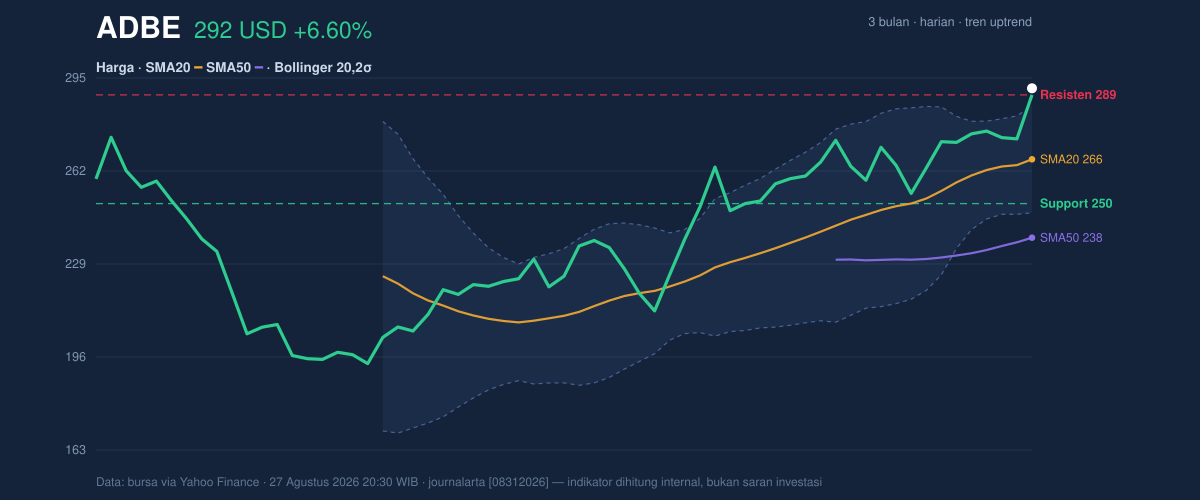
The more important detail is location. Adobe is trading at 106% of its 20-hour range, which means it is pressing above the recent resistance zone rather than sitting comfortably inside it. The 20-hour resistance at 289.15 has been overtaken, and the stock is now testing whether that level can flip into support. If it does, the breakout gains credibility; if it does not, the move risks being read as an overextended spike.
Oscillators & Momentum
The momentum picture is mixed, and that mix is exactly what makes the current setup interesting. The RSI(14) at 67.4 is described as neutral, but it is close enough to the overbought zone to show the rally has become mature. By contrast, the Stochastic %K at 94.9 and %D at 85.7 is clearly overbought, which usually means the stock has been closing near the top of its recent trading range for long enough to raise the odds of a pause. That does not automatically signal reversal; it often means momentum is strong, but stretched.
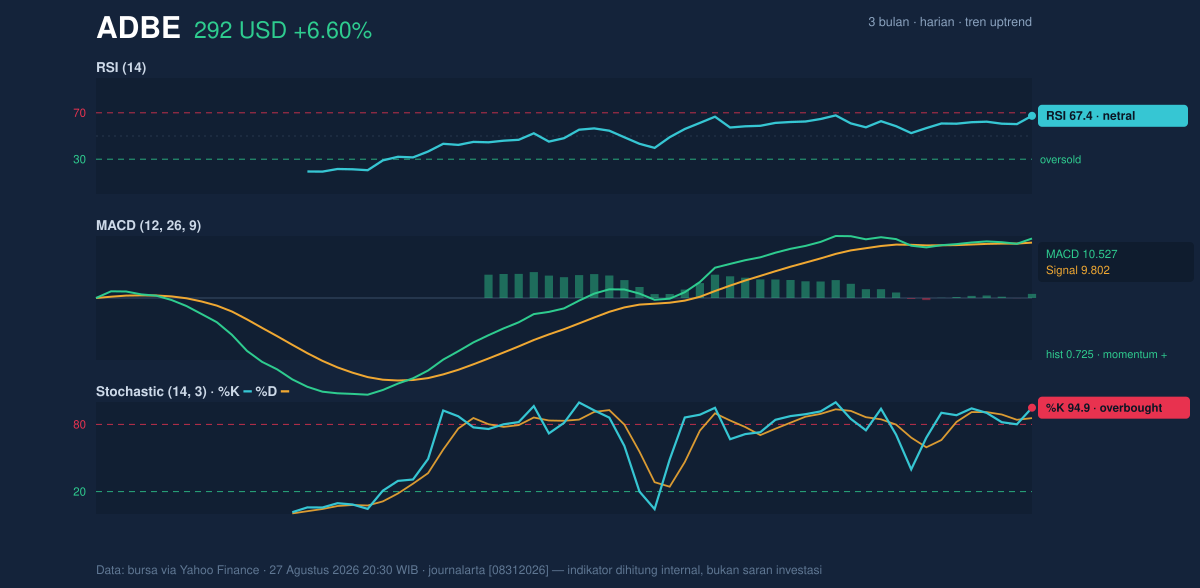
The MACD at 10.527 above the signal line at 9.802, with a positive histogram of 0.725, says trend momentum is still expanding. MACD is useful here because it measures whether the stock’s recent acceleration is improving or fading. Right now it is still improving. So the message from the oscillators is not “trend over,” but rather “trend strong, short-term heat elevated.”
Volatility & Volume
Bollinger Bands add another layer to the story. Adobe’s price is above the upper Bollinger band at 285.26, with %B at 116%, which means the stock has moved beyond the normal envelope of its recent 20-day volatility. That often happens during strong breakouts, but it also raises the odds of mean reversion — a move back toward the middle band — if follow-through volume fades. The Bollinger band width of 14.3% is called normal, so the market is not in an unusually compressed setup that would typically precede a violent expansion. Instead, the move is already happening, and the question is whether participation can sustain it.
Volume argues that the rally is not purely cosmetic. The latest print of 6,521,600 shares is about 1.5× the 20-session average of 4,343,330, and OBV is rising. That combination matters because rising volume on an advance usually means institutions or larger participants are involved, not just retail churn. In other words, the move has sponsorship.
Key Levels & Scenarios
The immediate technical map is straightforward. The stock has already cleared the 20-hour resistance at 289.15, and the next reference point is the 3-month high at 291.18, which has effectively been challenged by the latest trade at 291.52. On the downside, the first meaningful support sits at the 20-hour support at 250.41, while the SMA20 at 266.20 is the more important trend line to watch because it marks the center of the current advance. If price holds above the breakout area, the chart suggests continuation can remain intact. If it slips back below the former resistance, the market may begin treating the surge as a failed breakout rather than a fresh leg higher.
A clean hold above 289.15 would keep the breakout narrative alive.
A drop back under 266.20 would weaken that narrative quickly.
Technical Verdict: HOLD (wait & see)
HOLD (wait & see) — the trend is strong, but the stock is now stretched enough that confirmation matters more than enthusiasm.
- MACD remains positive, with the line above signal and a positive histogram, which supports ongoing upside momentum.
- Volume is 1.5× average and OBV is rising, showing the move has real participation.
- Stochastic is overbought and price is above the upper Bollinger band, which raises the risk of near-term cooling or a pullback toward the mid-band.
Verdict invalidated if price breaks below 266.20.
- Ideal entry range: 266.20 to 289.15
- Exit target: 291.18 to 291.52
- Stop loss protection: 250.41
For non-traders: Adobe is trending higher, but it has run far enough that the market needs to prove the breakout is real before the next move can be trusted.
Summary Data ADBE
| Last price | 291.52 USD |
| Change 1 day / 5 days / 1 month | 6.60% / 7.09% / 17.60% |
| Trend / MA-cross | uptrend / none |
| SMA20 / SMA50 | 266.20 / 238.27 |
| RSI (14) / Stochastic %K | 67.4 / 94.9 |
| Bollinger %B / ATR | 116% / 10.69 |
| Support / Resistance 20 days | 250.41 / 289.15 |
| Data as of | 27 Agustus 2026 20:30 WIB |
Track ADBE stock price daily: live levels, support/resistance and our full ADBE analysis history.