Alibaba Stock Drops 1.13%, Momentum Weakens In Focus
On September 1, 2026: price 114.20 HKD, trend sideways, RSI 43.8, support 112.50, resistance 128.10. technical analysis of alibaba stock.
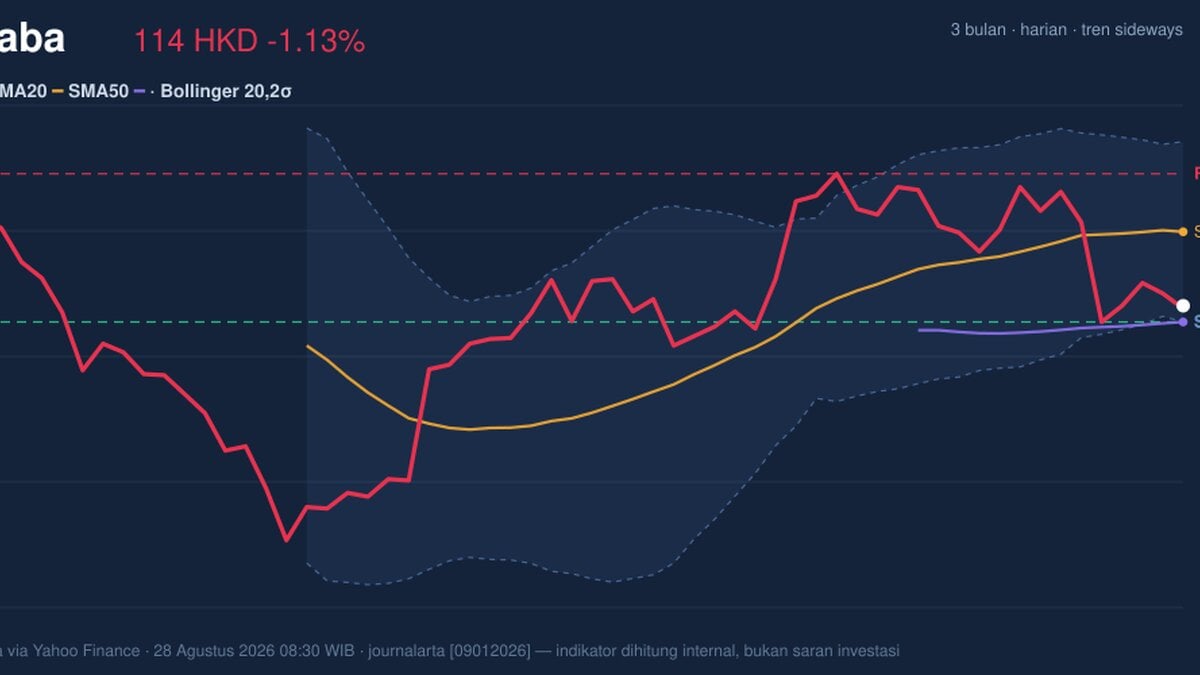
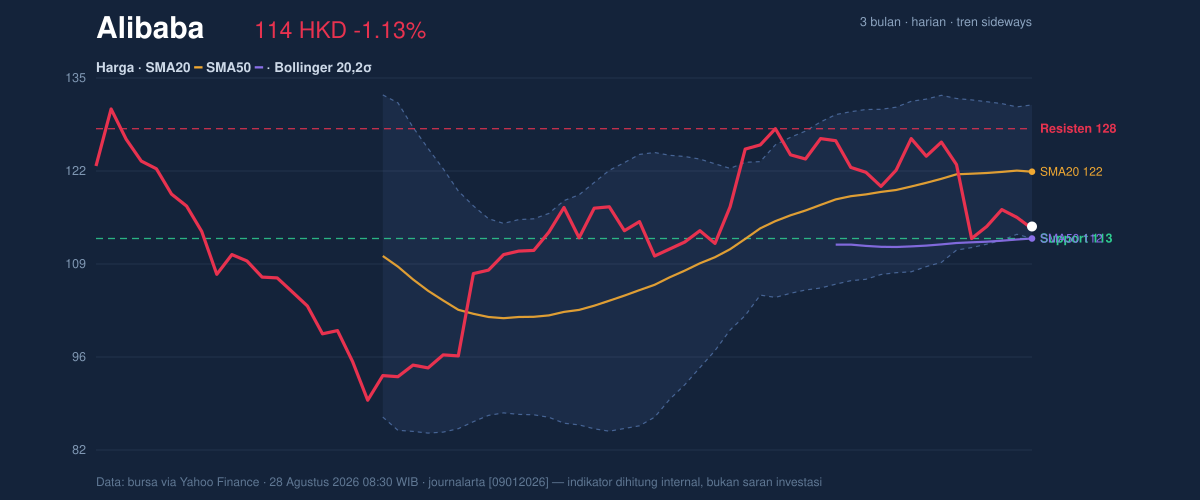
Alibaba Group’s Hong Kong-listed shares fell to HK$114.20 on HKEX on 28 August 2026, extending a short-term slide that has pushed the stock well below its SMA20 at HK$121.99 while still holding above the SMA50 at HK$112.49. The tape is telling a mixed story: the broader trend is still sideways, but near-term price action is weak, momentum has turned negative, and volume has not shown the kind of surge that usually marks a decisive reversal. As shown in the chart, the market is sitting in the lower half of its recent range, with traders watching whether the stock can defend the lower band and the nearby support zone.
Trend & Price Action
The first signal is structural: Alibaba is trading below its SMA20, which means the latest bounce attempts have not yet regained short-term control from sellers. At the same time, the stock remains above the SMA50, so the longer of the two reference averages is still acting as a floor rather than a breakdown point. That combination usually reads as a market in transition rather than a clean trend. There is no new MA-cross, so the chart has not delivered the kind of moving-average confirmation that often accompanies a sustained shift in direction.
The Bollinger setup reinforces that reading. Price is near the lower edge of the band structure, with %B at 9%, which means the stock is trading very close to the lower band and has little room before the chart starts signaling oversold pressure. Yet the Bollinger band width of 15.6% is described as normal, not compressed, so this is not a calm consolidation waiting for a breakout. It is a market with enough room to move, and the current drift lower suggests sellers still have the initiative.
A close above the middle band would matter.
Oscillators & Momentum
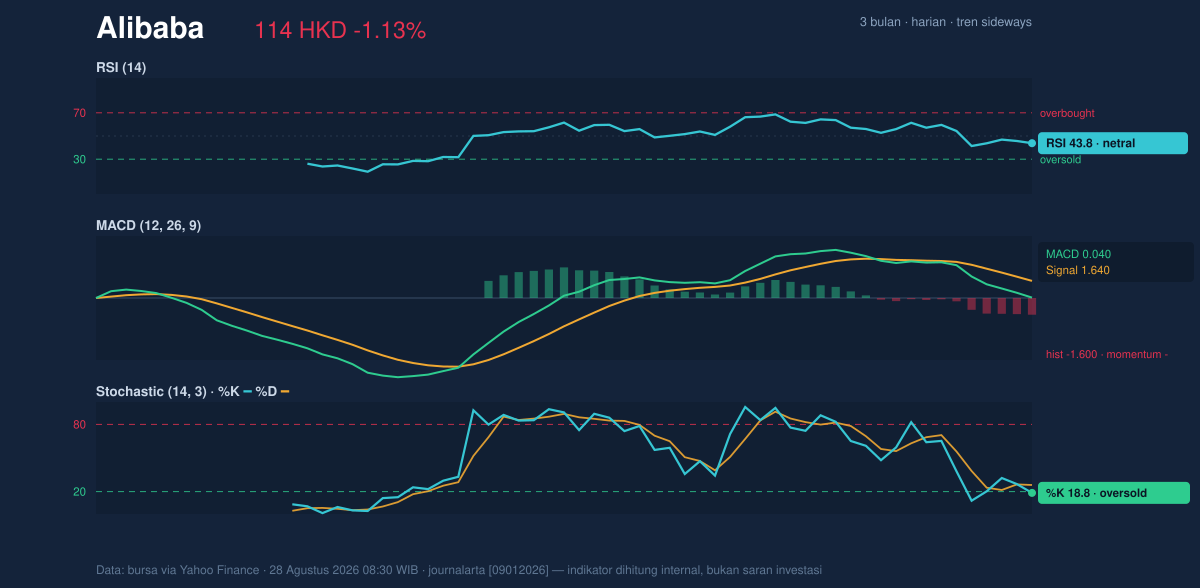
The momentum tools are split, but not in a reassuring way. The RSI at 43.8 is neutral, which means the stock is neither overbought nor deeply oversold on that measure. However, the Stochastic %K at 18.8 and %D at 25.9 are in oversold territory, showing that recent price closes have been weak relative to the recent range. In plain terms, this says the stock has been under pressure enough to look stretched on a short-term basis, but not so severely stretched that a rebound is guaranteed.
The more important warning comes from MACD. With MACD at 0.040, signal at 1.640, and a histogram of -1.600, momentum is still negative. The histogram is the gap between the MACD line and its signal line; when it is negative, the trend impulse is still leaning downward. That matters because it tells readers the stock may be oversold in the short run, but it has not yet built the internal strength needed to reverse that weakness. As shown in the chart, the oscillators are not aligned with a bullish turn.
The chart is oversold, not healed.
Volatility & Volume
Volatility is elevated enough to keep traders alert. The ATR(14) at 4.85 equals 4.2% of the share price, which indicates wide daily movement relative to the current level. ATR, or average true range, is a measure of how much a stock typically moves in a day; a higher reading means stops and support levels can be tested quickly. In Alibaba’s case, that means any break of support could unfold fast, but it also means a sharp rebound can happen just as quickly if buyers step in.
Volume, however, has not confirmed that kind of reversal. The latest turnover of 73,086,522 is only 0.7× the 20-day average of 105,028,188, and OBV is falling. OBV, or on-balance volume, tracks whether trading activity is flowing into or out of the stock; a declining OBV suggests that volume is still favoring distribution rather than accumulation. That is a meaningful signal because a falling price on lighter-than-normal volume can sometimes be a pause, but a falling OBV says the broader participation is still not convincingly supportive.
Key Levels & Scenarios
The most important nearby reference is support at HK$112.50, which sits almost exactly on the SMA50 at HK$112.49. That overlap makes the area technically important: if the stock loses that zone, the chart would move from “weak but range-bound” toward a more clearly damaged structure. On the upside, resistance at HK$128.10 is the first level that would need to be cleared to show the market is recovering control. The 3-month high at HK$131.20 sits just above that resistance, so a move through HK$128.10 would still need follow-through to challenge the upper end of the recent range.
At HK$114.20, the share price is positioned in the lower part of its 20-day range, which means the market is closer to support than to resistance. That placement matters because it leaves limited room for error: a slip below support would likely trigger more technical selling, while a recovery above the middle band would signal that the lower-band pressure is easing.
Technical Verdict: HOLD (wait & see)
HOLD (wait & see) is the clearest technical verdict because the chart is weak, but not broken. The stock is below the SMA20, MACD is negative, and OBV is falling, all of which argue that momentum still favors sellers. At the same time, Stochastic is oversold and price remains above the SMA50 / HK$112.50 support, which means the downside has not yet confirmed a full breakdown.
- Entry Range: HK$112.50 to HK$114.20, where support and the current price zone overlap.
- Exit Target: HK$121.99 first, then HK$128.10 if price can reclaim the middle Bollinger band and resistance.
- Stop Loss protection: below HK$112.49, because that is the SMA50 and the key support line.
- Verdict invalidated if price breaks below HK$112.49, since that would turn the current range into a failed support test.
In plain English, the stock is weak enough to be cautious, but not weak enough yet to declare the range has fully broken.
Alibaba’s Hong Kong shares were last quoted at HK$114.20 on 28 August 2026.
Summary Data Alibaba
| Last price | 114.20 HKD |
| Change 1 day / 5 days / 1 month | -1.13% / -7.15% / -2.39% |
| Trend / MA-cross | sideways / none |
| SMA20 / SMA50 | 121.99 / 112.49 |
| RSI (14) / Stochastic %K | 43.8 / 18.8 |
| Bollinger %B / ATR | 9% / 4.85 |
| Support / Resistance 20 days | 112.50 / 128.10 |
| Data as of | 28 Agustus 2026 08:30 WIB |
Track Alibaba share price daily: live levels, support/resistance and our full Alibaba analysis history.