BP Stock Drops 0.17%, Testing Support Level In Focus
On September 1, 2026: price 514.50 GBp, trend sideways, RSI 44.0, support 514.50, resistance 552.20. technical analysis of bp stock. BP Stock Drops — full…
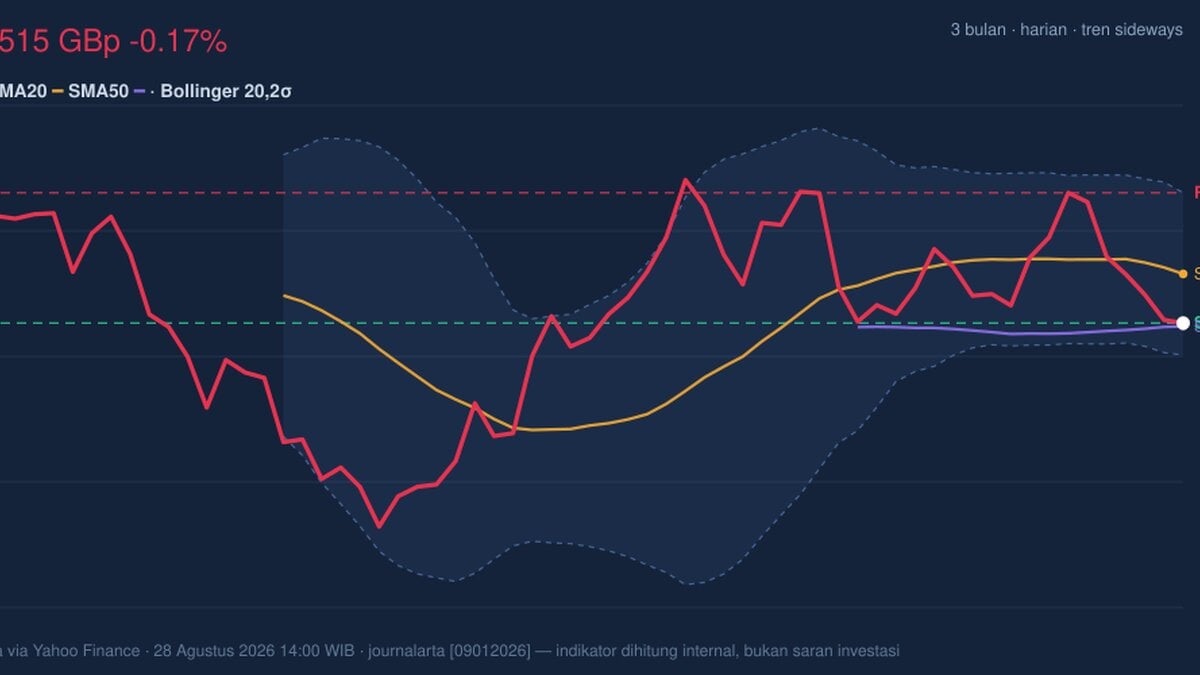
BP plc is trading at a technically fragile point: the London-listed oil major is holding just above a short-term support line while broader momentum still points lower, leaving the next move dependent on whether buyers can defend the low end of the recent range. The shares last changed hands at 514.50 GBp, down 0.17% on the day, after a 6.37% slide over five days and a 6.88% drop over one month, according to exchange data via Yahoo Finance.
Trend & Price Action
The chart shows a stock that is no longer trending cleanly in either direction. BP is below its SMA20 at 528.72, while SMA50 stands at 513.58, putting the price just above the longer average but still beneath the shorter one. That configuration matters: it usually means the market has lost near-term momentum, even if the medium-term floor has not fully broken.
There is no fresh MA cross, so this is not yet a decisive trend reversal signal. Instead, the picture is one of drift: the SMA20 slope is -0.79% over five days, which tells readers the recent path of least resistance has been downward. In plain language, the stock is not in a strong uptrend waiting to resume; it is trying to stabilise after weakness.
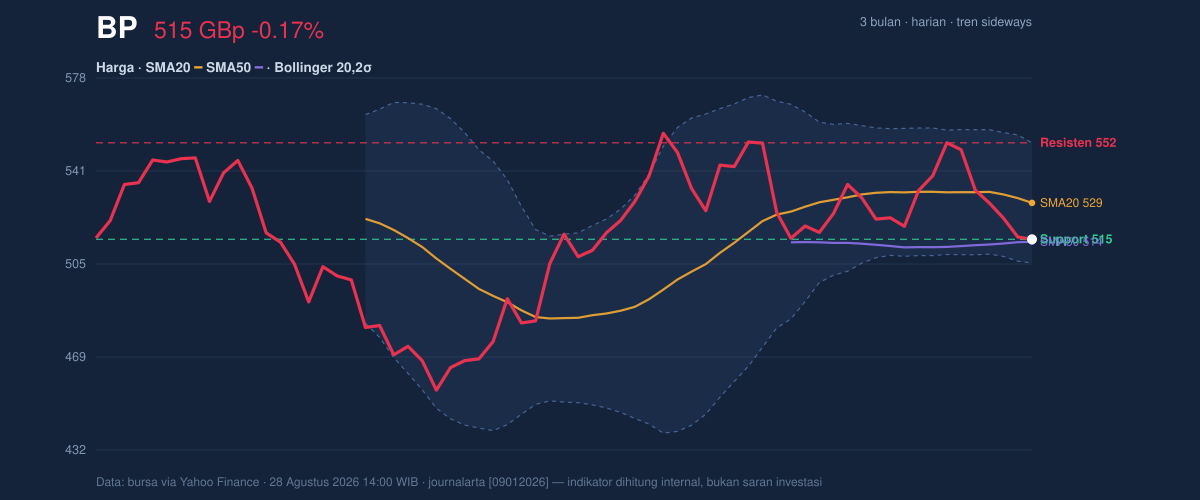
BP is also sitting at the very bottom of the short-term range, with 20-hour support at 514.50 and 20-hour resistance at 552.20. That means the shares are currently at 0% of the range, a position that usually signals pressure rather than balance. The broader three-month range of 450.60 to 562.90 shows that the stock is still well above the lower extreme, but not far enough from recent support to suggest comfort.
Oscillators & Momentum
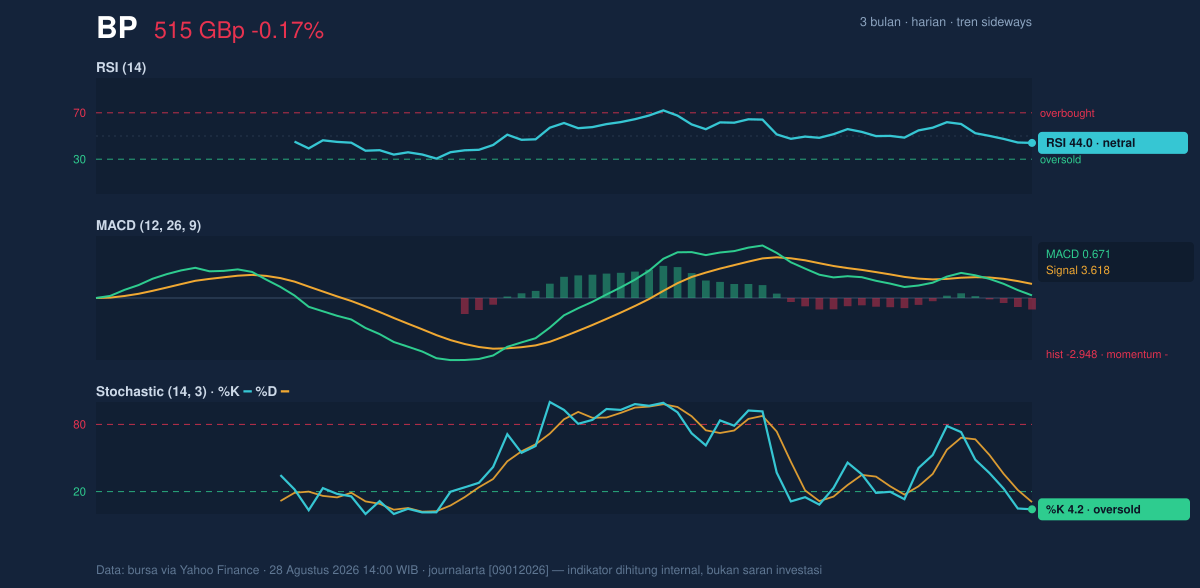
Momentum indicators are mixed, but the balance is still cautious. RSI at 44.0 is neutral, which means the stock is neither stretched on the upside nor deeply washed out. That matters because neutral RSI does not provide a strong argument for immediate recovery; it simply says the market has room to move either way.
The more important signal comes from stochastics. Stochastic %K at 4.2 and %D at 10.6 place BP in oversold territory. For general readers, oversold does not mean “cheap”; it means selling has been intense enough that the stock may be vulnerable to a bounce if pressure eases. But oversold conditions can persist when the broader trend remains weak, so this is a warning light rather than a turnaround guarantee.
The MACD setup is still negative. MACD at 0.671 sits below the signal line at 3.618, with a histogram of -2.948. That gap is important because it shows downside momentum still outweighs upside momentum. In practical terms, the stock may be oversold, but it has not yet proved that sellers are exhausted.
Volatility & Volume
Volatility is present, but not extreme. ATR(14) at 12.16, or 2.4% of price, suggests daily movement is moderate rather than chaotic. The Bollinger Bands help frame that further: the upper band is 552.19, the middle band 528.72, and the lower band 505.25. With %B at 20%, BP is trading near the lower edge of its band structure, which usually means the market is priced defensively and may need fresh buying volume to shift higher.
The band width is 8.9%, described as normal. That is useful because it indicates the stock is not in a volatility squeeze waiting for a dramatic expansion; instead, the move underway is already being expressed in the price. Volume supports that reading. 65,231,451 shares changed hands, versus a 20-day average of 52,824,121, or 1.2 times normal. More activity during weakness often suggests the move has real participation behind it. The fact that OBV is falling reinforces that interpretation: more volume has been associated with net selling pressure, not accumulation.
Key Levels & Scenarios
The immediate technical map is fairly clear.
- Support: 514.50 is the first line to watch, because the last price is sitting right on it.
- Secondary support: 505.25, the lower Bollinger band, is the next downside reference if the first level gives way.
- Resistance: 528.72, the SMA20 and Bollinger middle band, is the first hurdle for any rebound.
- Upper resistance: 552.19/552.20 is the zone that would need to be reclaimed to suggest the pressure is easing.
- Three-month high at 562.90 remains the broader upside marker, while 450.60 is the deeper range floor.
If BP can hold 514.50 and push back through 528.72, the chart would start to look less fragile, especially given the oversold stochastic reading. If it fails to hold 514.50, the next technical test is the 505.25 lower band, where buyers would need to prove they can absorb the selling.
Technical Verdict: HOLD (wait & see)
- RSI at 44.0 is neutral, so there is no strong momentum case either way.
- Stochastic is oversold, which can support a bounce, but MACD remains negative, showing the broader short-term impulse is still weak.
- Price below SMA20 and OBV falling suggest sellers still have the upper hand despite volume running above average.
Verdict invalidated if price falls below 505.25, because that would break the lower Bollinger band and weaken the current support structure.
- Ideal Entry Range: 505.25 to 514.50
- Exit Target: 528.72, then 552.19
- Stop Loss protection: below 505.25
For non-traders, this means BP is sitting in a zone where the chart is waiting for proof: either the stock steadies and reclaims its short-term average, or the recent weakness extends into the next support band. The next scheduled signal will come from how it behaves around 514.50 and 505.25.
Summary Data BP
| Last price | 514.50 GBp |
| Change 1 day / 5 days / 1 month | -0.17% / -6.37% / -6.88% |
| Trend / MA-cross | sideways / none |
| SMA20 / SMA50 | 528.72 / 513.58 |
| RSI (14) / Stochastic %K | 44.0 / 4.2 |
| Bollinger %B / ATR | 20% / 12.16 |
| Support / Resistance 20 days | 514.50 / 552.20 |
| Data as of | 28 Agustus 2026 14:00 WIB |
Track BP share price daily: live levels, support/resistance and our full BP analysis history.



