HSBC Stock Technicals Today: Drops 0.49%, Testing Support Level
On September 1, 2026: price 161.00 HKD, trend sideways, RSI 51.3, support 160.10, resistance 168.20. technical analysis of hsbc stock. HSBC Stock Technicals —…
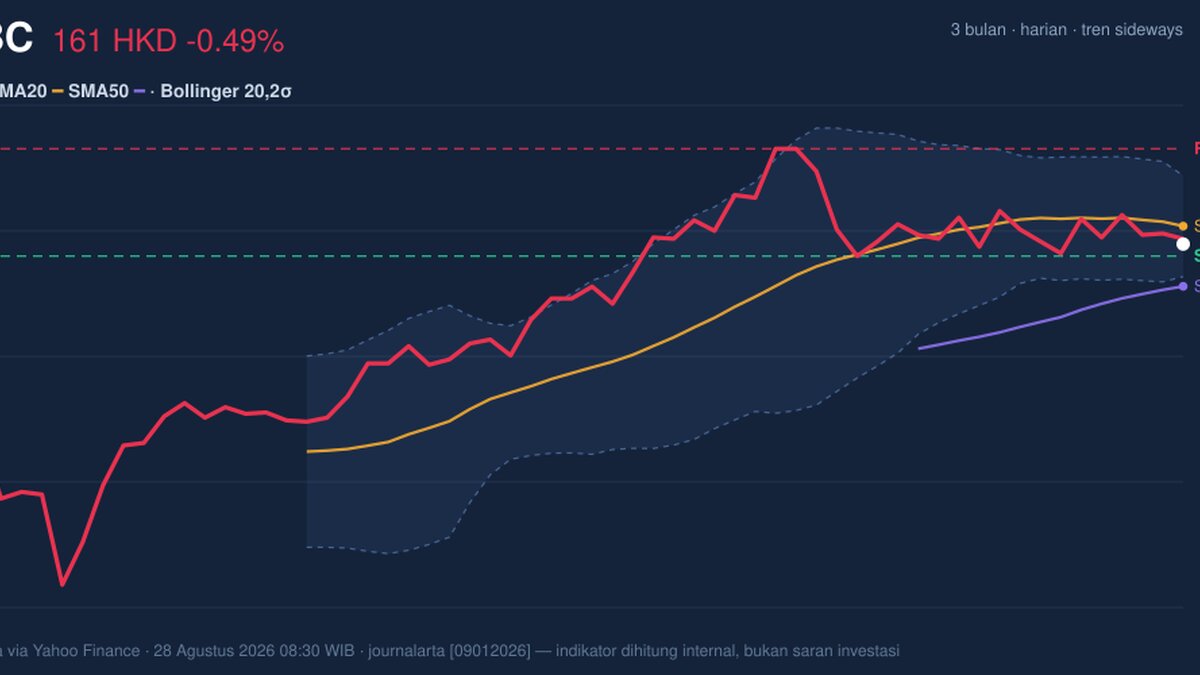
At HKEX, HSBC Holdings slipped to 161.00 HKD on 28 August 2026, down 0.49% from the previous close of 161.80, leaving the stock just below its short-term average and still inside a broad, well-defined trading band. The move matters less for the size of the drop than for what it says about positioning: HSBC is not breaking down, but it is also not yet reclaiming the momentum needed to push decisively higher. With the shares sitting below the 20-day moving average and volume running below normal, the market is signaling caution rather than conviction.
Trend & Price Action
HSBC’s price structure is best described as sideways, with the 20-day moving average drifting lower at -0.39% over five days. That slope is important because a moving average is not just a line on a chart; it reflects the direction of recent consensus pricing. When it tilts down, it usually means sellers have been able to keep a lid on rallies. The stock is trading below SMA20 at 162.35, but still above SMA50 at 157.81, which puts it in a middle ground: short-term softness, but not a full trend reversal. There is no fresh MA cross, so the chart does not yet show a new bullish or bearish regime shift.
The Bollinger Bands reinforce that message. Price is near the lower half of the band structure, with %B at 32%, meaning the stock is closer to the lower band than the upper band but not under pressure enough to suggest a breakdown. The band width of 4.7% is relatively tight and described as a squeeze, which often means the market is storing energy for a larger move. In plain English: the chart is calm now, but calm charts can turn fast once a level gives way.
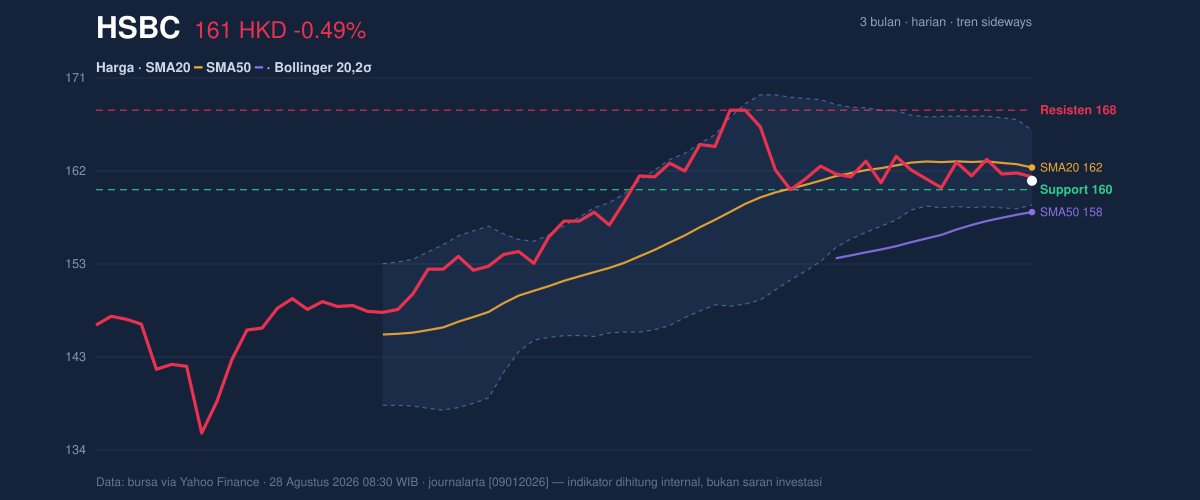
The stock is also trading only around the lower portion of its recent range, with 20-hour support at 160.10 and 20-hour resistance at 168.20. That places the current price closer to support than resistance, but not close enough to call it a bounce yet.
Oscillators & Momentum
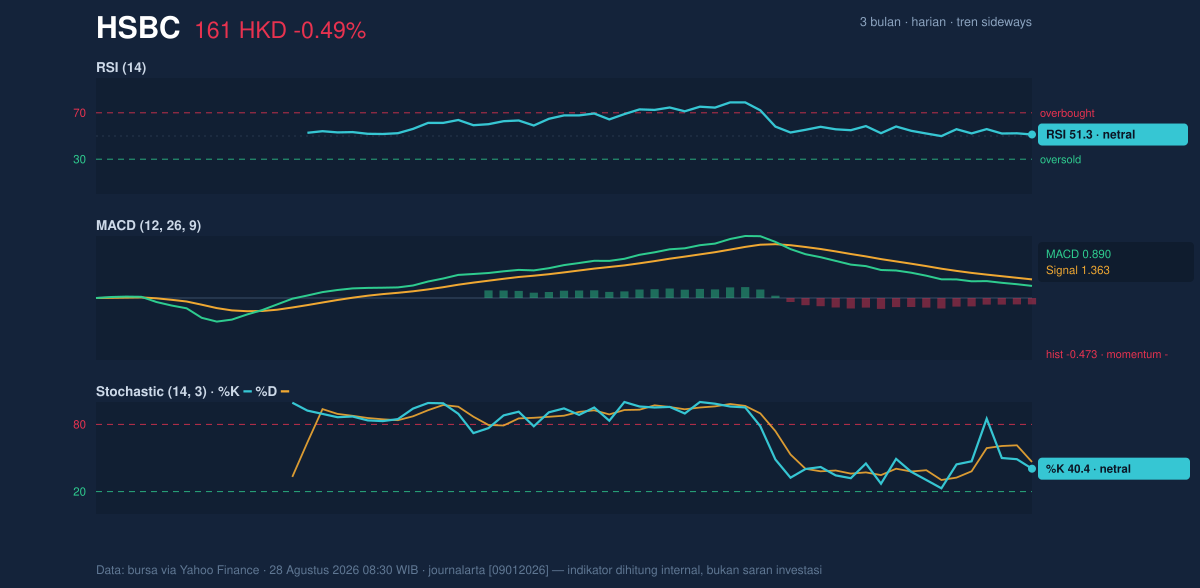
The momentum indicators are mixed, which is usually a sign that the market has not chosen a direction. RSI(14) at 51.3 is neutral, and that matters because RSI measures whether a stock is stretched too far in one direction. A reading near 50 says neither buyers nor sellers have a clear edge. The Stochastic %K at 40.4 and %D at 46.5 also sit in neutral territory, with %K below %D. That configuration hints at a softening short-term rhythm, but not yet a full oversold setup.
The more important signal is from MACD. HSBC’s MACD at 0.890 sits below its signal line at 1.363, leaving a -0.473 histogram. That negative histogram means recent price action is losing pace versus the longer-term trend. For readers, MACD is essentially a momentum comparison tool: when the MACD line falls below the signal line, it often suggests that upside momentum is fading before price itself looks weak on the surface.
Put simply, the oscillators are not bearish enough to panic, but they are not supportive enough to argue for a clean upside break.
Volatility & Volume
Volatility is subdued. The ATR(14) of 2.16, equal to 1.3% of price, suggests the stock is moving in relatively small daily increments. Low ATR often pairs with a squeeze in Bollinger Bands, and that combination can be deceptive: it looks quiet right before the market decides to move more sharply. The key question is not whether HSBC can move, but which side of the range gets control first.
Volume is not confirming strength. Last volume of 7,128,635 was only 0.7× normal versus the 20-day average of 10,792,695, while OBV is falling. OBV, or on-balance volume, tracks whether volume is flowing into the stock or away from it. A declining OBV alongside subdued turnover usually tells you that rallies are not being aggressively supported. That is a subtle but important warning: price is holding, but participation is thinning.
Key Levels & Scenarios
The technical map is straightforward. 160.10 is the first level to watch on the downside, because it is the nearest support and sits just under the current price. If that floor fails, the chart would likely shift from sideways drift into a deeper retracement toward the lower part of the broader range. On the upside, 162.35 is the first hurdle because it is the 20-day average and the Bollinger middle band. A move back above that line would be an early sign that short-term pressure is easing. Above that, 168.20 is the next resistance, and a break there would put the stock back into the upper end of its recent band, closer to the 169.70 three-month high.
The broader range still matters. With the three-month low at 133.50, HSBC remains well above the lower end of its recent history, which means the longer-term base has not been damaged. But the current setup says the stock needs a clear catalyst to escape the range.
Technical Verdict: HOLD (wait & see)
HOLD (wait & see)
- RSI at 51.3 and Stochastic at 40.4/46.5 are neutral, so momentum is not strong enough to confirm a directional break.
- MACD below signal with a -0.473 histogram shows fading upside momentum.
- Price below SMA20 at 162.35, combined with a 4.7% Bollinger squeeze, points to compression rather than confirmation.
Verdict invalidated if price falls below 160.10, which would weaken the nearest support and tilt the chart more clearly bearish.
- Ideal Entry Range: 160.10 to 162.35
- Exit Target: 168.20
- Stop Loss protection: below 160.10
For non-traders, this means HSBC is paused in a tight range, and the chart needs a cleaner move before it shows its hand.
The latest three-month high remains 169.70.
Summary Data HSBC
| Last price | 161.00 HKD |
| Change 1 day / 5 days / 1 month | -0.49% / -1.17% / -4.28% |
| Trend / MA-cross | sideways / none |
| SMA20 / SMA50 | 162.35 / 157.81 |
| RSI (14) / Stochastic %K | 51.3 / 40.4 |
| Bollinger %B / ATR | 32% / 2.16 |
| Support / Resistance 20 days | 160.10 / 168.20 |
| Data as of | 28 Agustus 2026 08:30 WIB |
Track HSBC share price daily: live levels, support/resistance and our full HSBC analysis history.