Testing Support Level, Wilmar Stock Drops 0.85% on Thursday
On October 15, 2026: price 3.48 SGD, trend downtrend, RSI 38.3, support 3.46, resistance 3.68. technical analysis of wilmar stock. Testing Support Level — full…
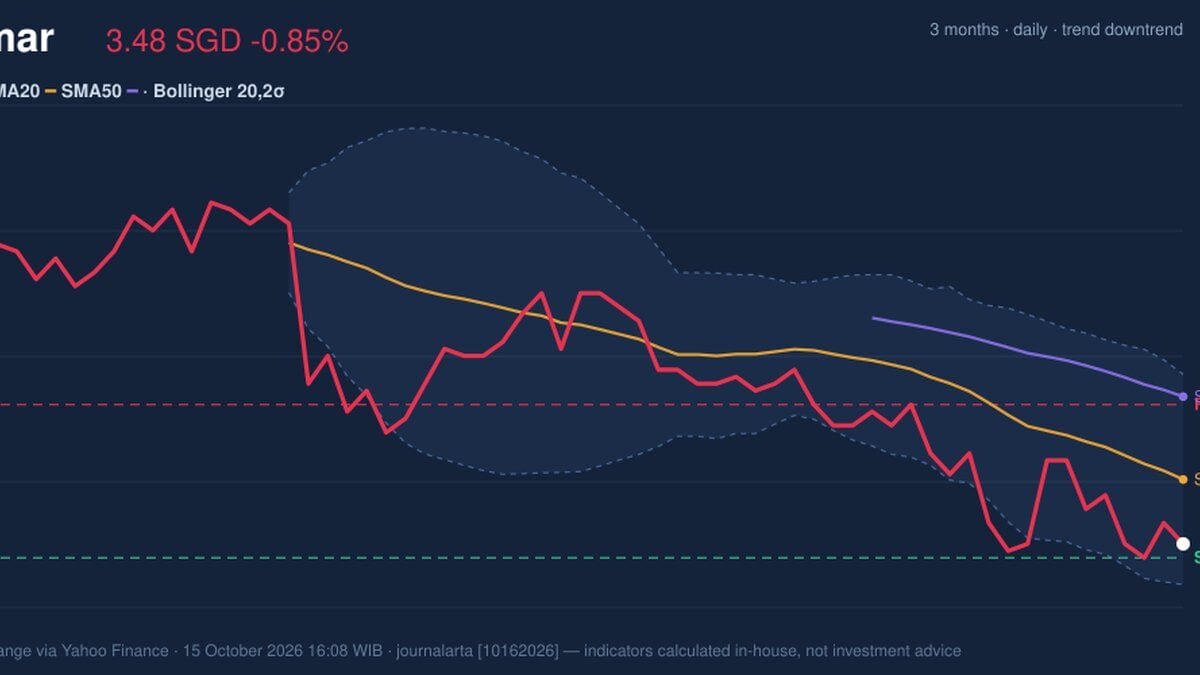
Trend & Price Action
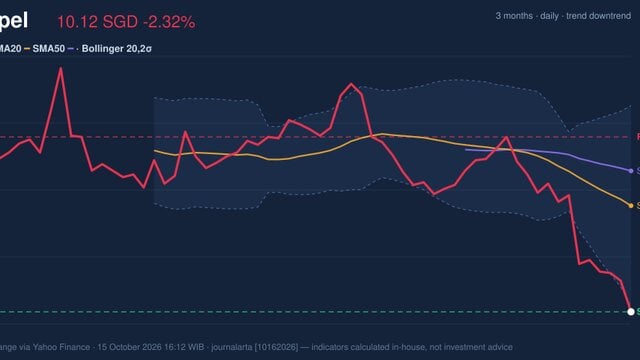
Wilmar’s share price is below both its 20-day simple moving average, at S$3.57, and its 50-day average, at S$3.69. The 20-day average is falling, while the stock has lost 1.42% over five days and 6.70% over one month. That combination points to a weakening short-term structure, not just a one-day decline. There has been no recent moving-average crossover to signal a change in direction. The shares sit near the bottom of their 20-trading-day range, between support at S$3.46 and resistance at S$3.68. The nearby S$3.43 three-month low is an important test: holding above it could help stabilise the price, while a break below would put the recent floor in question. As shown in the chart, the price remains below the moving averages and close to the lower end of its range.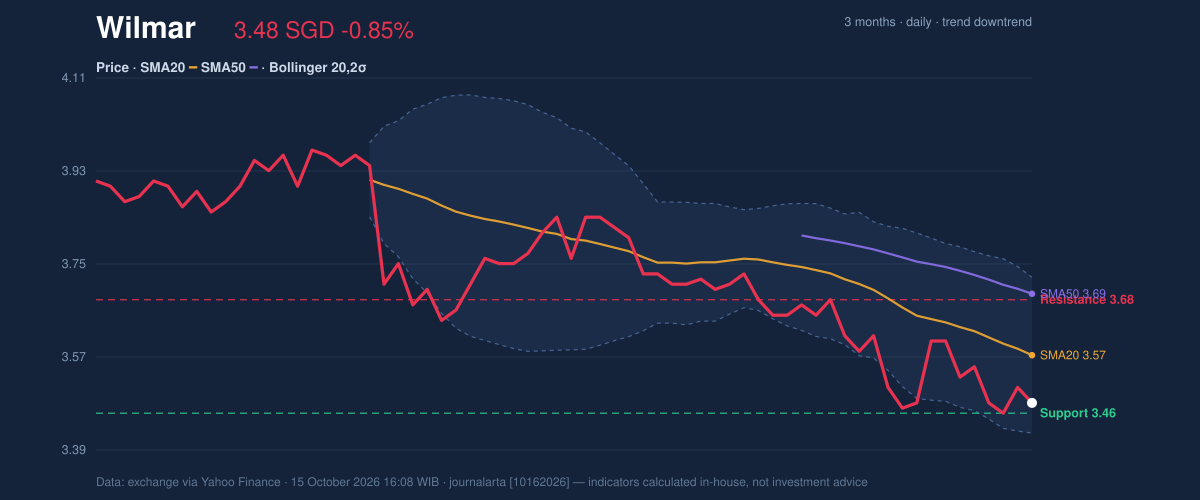
Oscillators & Momentum
The indicators offer a mixed message. The Stochastic reading is in oversold territory, with %K at 19.2 and %D at 20.5; that means the price has fallen enough to raise the possibility of a pause or rebound, but it does not establish that a reversal is underway. The RSI is 38.3, a neutral reading that is nevertheless consistent with weak momentum. Oversold Stochastic readings are a warning of stretched selling, not proof that the decline has finished. MACD remains negative at -0.062, just below its -0.060 signal line, and its histogram is also negative. The MACD therefore still confirms downward momentum rather than a bullish turn. The distinction matters: an oversold oscillator can coexist with a downtrend, particularly when the price remains below its moving averages.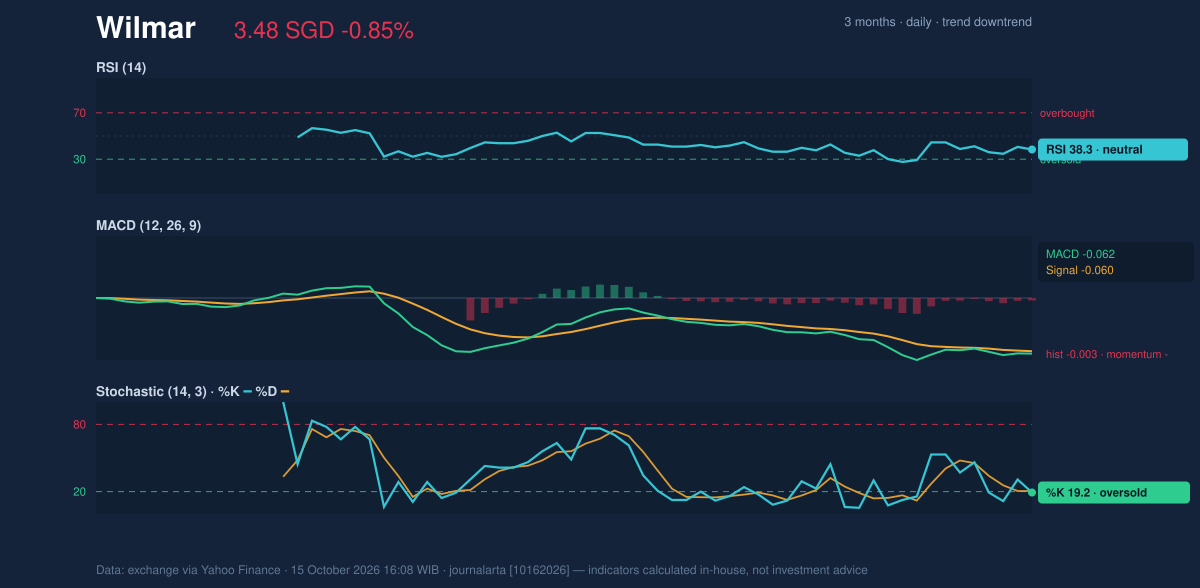
Volatility & Trading Activity
Wilmar’s Bollinger Bands—the range around a moving average used to gauge how far prices have strayed from their recent norm—show the stock near the lower band. The %B reading is 19%, with the lower band at S$3.42 and the middle band at S$3.57. The position signals pressure near the bottom of the recent price range, but the normal band width of 8.5% does not indicate an unusually compressed or explosive setup. Average true range, a measure of typical price movement, is S$0.09, or 2.6% of the share price, pointing to moderate volatility. Trading volume was 5.30 million shares, about 0.9 times its 20-day average, while on-balance volume was falling. That combination suggests the decline has not drawn unusually heavy turnover, but the falling OBV also offers little evidence of sustained accumulation.Key Levels & Scenarios
The first test is support at S$3.46, followed by the three-month low at S$3.43. Holding those levels could give the oversold Stochastic room to recover; a move back above S$3.57, the 20-day average and Bollinger middle band, would provide a stronger sign of stabilisation. Resistance at S$3.68 and the 50-day average at S$3.69 form a higher hurdle. A break beneath S$3.43 would invalidate the stabilisation case and deepen the technical damage. Conversely, a recovery through S$3.57 would still need confirmation from momentum indicators, which remain negative.Technical Verdict: HOLD (wait & see)
The technical reading is HOLD (wait & see): the falling moving average and negative MACD favour caution, while the oversold Stochastic and proximity to the three-month low leave room for a rebound but do not confirm one. The verdict is invalidated if the price falls below S$3.43.- Indicative entry range: S$3.46–S$3.57, bounded by 20-day support and the 20-day average.
- Indicative exit target: S$3.68–S$3.69, the 20-day resistance and 50-day average area.
- Indicative stop-loss protection: Below S$3.43, the three-month low.
Source: Singapore Exchange market data via Yahoo Finance, as of 15 October 2026, 16:08 WIB.
Why Wilmar is in focus today
- Trading near its 3-month low (3.43)
- Downtrend extending (5-day change -1.42%)
Selected automatically from 16 SGX (Singapore) stocks by a technical-signal score with daily weighted randomisation — not a recommendation.
Summary Data Wilmar
| Last price | 3.48 SGD |
| Change 1 day / 5 days / 1 month | -0.85% / -1.42% / -6.70% |
| Trend / MA-cross | downtrend / none |
| SMA20 / SMA50 | 3.57 / 3.69 |
| RSI (14) / Stochastic %K | 38.3 / 19.2 |
| Bollinger %B / ATR | 19% / 0.09 |
| Support / Resistance 20 days | 3.46 / 3.68 |
| Data as of | 15 October 2026 16:08 WIB |
Disclaimer: This technical analysis is generated automatically from exchange data (via Yahoo Finance) and indicators calculated by JournalArta, for information and education only. The verdict and the entry, target and stop-loss levels are not investment advice or a solicitation to buy or sell any security. Investment decisions and their risks rest solely with the reader.
Track Wilmar share price daily: live levels, support/resistance and our full Wilmar analysis history.