HKEX Testing Support Level: Stock Drops 0.59% (October 15, 2026)
On October 15, 2026: price 371.40 HKD, trend downtrend, RSI 33.5, support 371.40, resistance 397.40. technical analysis of hkex stock. HKEX Testing Support…
Trend & Price Action
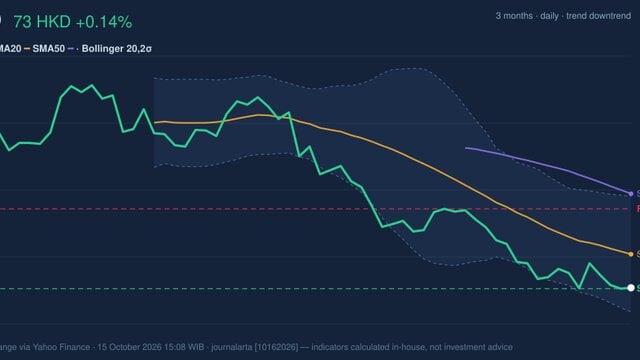
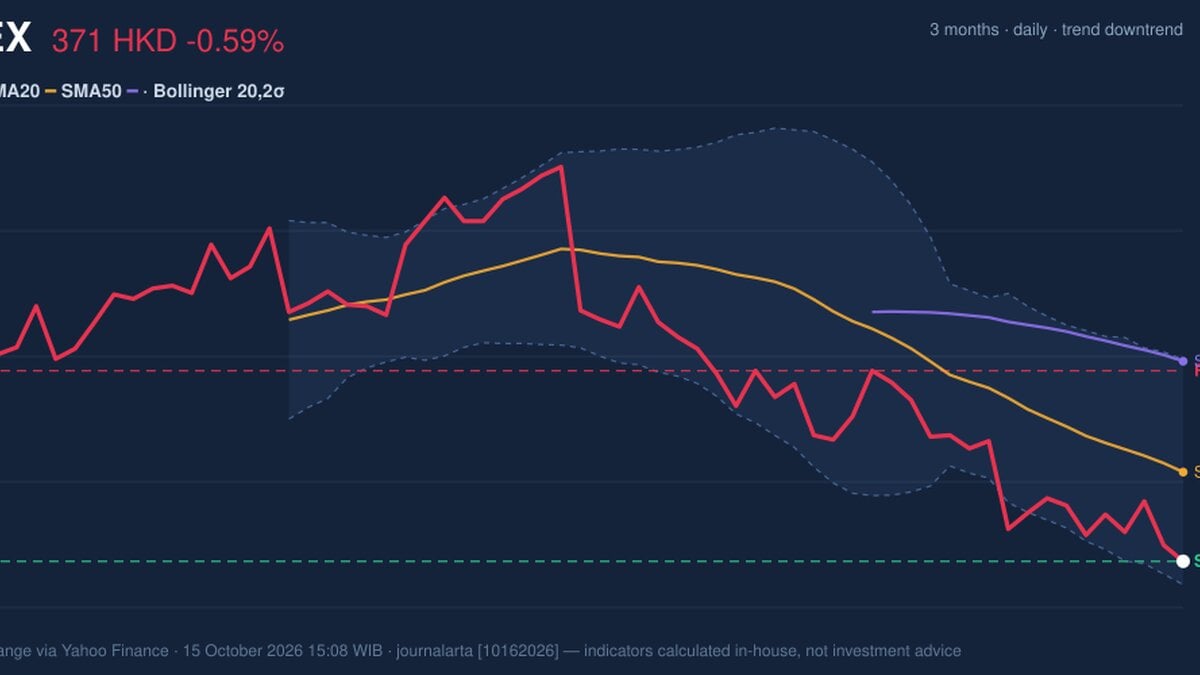
HKEX is down 0.96% over five days and 6.12% over one month. Its price sits below both the 20-day simple moving average (SMA), at HK$383.58, and the 50-day SMA, at HK$398.68. The 20-day average is falling, down 1.27% over five days, a sign that recent weakness is not just a one-day move. There has been no new moving-average crossover, so the signal comes from price remaining below both averages rather than a fresh change in their relationship. The stock is at the lower edge of its 20-trading-day range, with support at HK$371.40 and resistance at HK$397.40. Its three-month low is HK$369.40, putting the current price close to the recent floor. That proximity makes the area important, but it does not by itself confirm a rebound: a sustained break below the floor would suggest sellers are still in control.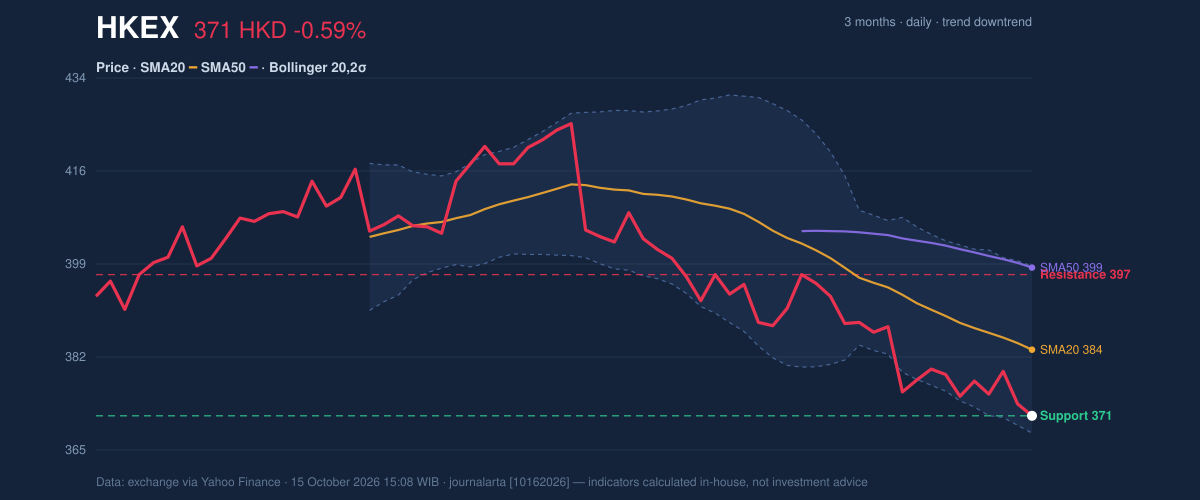
Oscillators & Momentum
The momentum indicators show weakness, with a possible short-term exhaustion signal but no clear reversal confirmation. The 14-day RSI is 33.5, which the supplied data classifies as neutral; it is weak, but not in the oversold category. The Stochastic reading is oversold, with %K at 8.5 and %D at 15.5. This can occur when prices have fallen sharply, though an oversold reading alone does not mean the decline has ended. MACD remains negative: at -6.988, it is below its signal line at -6.549, while the histogram is -0.440. That configuration indicates downside momentum is still present. In other words, the Stochastic points to stretched selling, but MACD has yet to confirm a change in direction.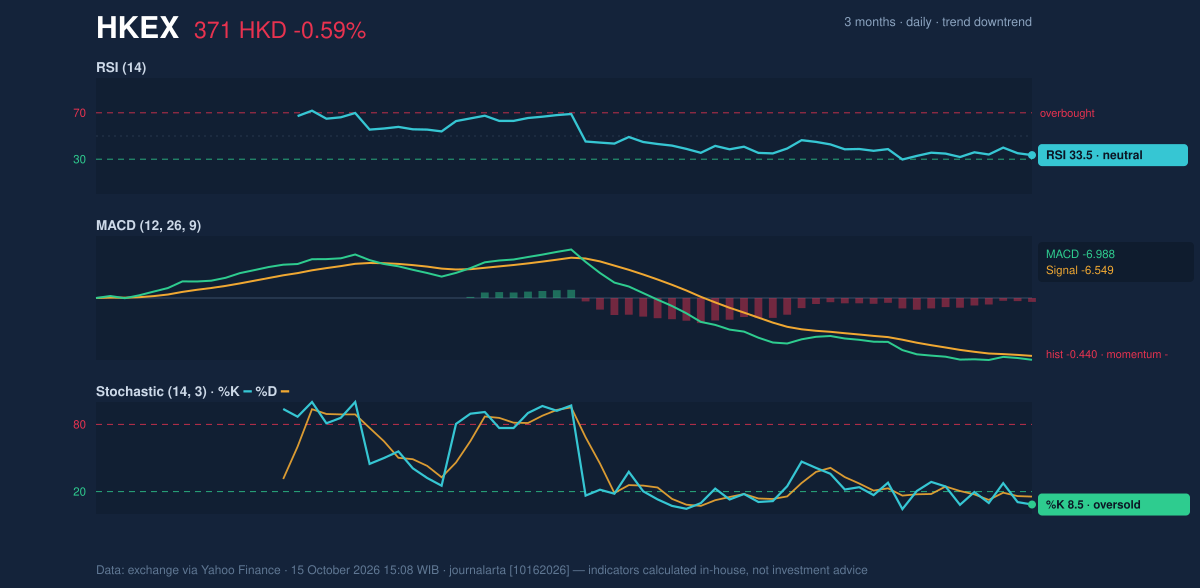
Volatility & Volume
The share price is near the lower Bollinger Band, at HK$368.22, with %B at 10%. The indicator places the price near the bottom of its recent statistical range; it can help identify unusually weak positioning, but does not establish that a bounce is due. The band width is 8.0%, described as normal, so the data does not show an unusually tight squeeze or a sharp expansion in volatility. Average true range (ATR) is HK$5.97, or 1.6% of the share price, indicating moderate day-to-day movement. Trading volume was 2,750,387 shares, about 0.9 times the 20-day average of 3,022,271. The below-average turnover offers limited evidence of a strong wave of selling on the latest session, but falling on-balance volume (OBV) suggests buying participation has not yet reversed the broader pressure.Key Levels & Scenarios
The immediate test is whether HKEX can hold the HK$369.40–HK$371.40 area, spanning its three-month low and 20-day support. Holding there could allow a recovery attempt, with the 20-day SMA at HK$383.58 the first reference point above the market. A move toward HK$397.40 would test 20-day resistance, while the 50-day SMA at HK$398.68 is a further marker of the prevailing downtrend. A break below HK$369.40 would weaken the support case. Conversely, a rebound that regains the 20-day average would improve the near-term chart, though the negative MACD and falling OBV mean confirmation would still matter.Technical Verdict: HOLD (wait & see)
The indicators support a cautious, conditional stance rather than a confirmed trend reversal. The strongest reasons are the falling 20-day SMA and price below both moving averages; negative MACD momentum; and oversold Stochastic readings near the three-month low, which raise the possibility of stabilization but do not confirm it. The verdict is invalidated if the price breaks below HK$369.40. - Ideal entry range: HK$369.40–HK$371.40, conditional on support holding. - Exit target: HK$383.58, the 20-day SMA; HK$397.40 is the next resistance reference. - Stop-loss protection: Below HK$369.40. For non-traders, the chart is weak but close to a recent floor, so the next signal depends on whether that floor holds or gives way.Data: exchange data via Yahoo Finance, as of October 15, 2026, 15:08 WIB.
Why HKEX is in focus today
- Trading near its 3-month low (369.40)
Selected automatically from 16 HKEX (Hong Kong) stocks by a technical-signal score with daily weighted randomisation — not a recommendation.
Summary Data HKEX
| Last price | 371.40 HKD |
| Change 1 day / 5 days / 1 month | -0.59% / -0.96% / -6.12% |
| Trend / MA-cross | downtrend / none |
| SMA20 / SMA50 | 383.58 / 398.68 |
| RSI (14) / Stochastic %K | 33.5 / 8.5 |
| Bollinger %B / ATR | 10% / 5.97 |
| Support / Resistance 20 days | 371.40 / 397.40 |
| Data as of | 15 October 2026 15:08 WIB |
Disclaimer: This technical analysis is generated automatically from exchange data (via Yahoo Finance) and indicators calculated by JournalArta, for information and education only. The verdict and the entry, target and stop-loss levels are not investment advice or a solicitation to buy or sell any security. Investment decisions and their risks rest solely with the reader.
Track HKEX share price daily: live levels, support/resistance and our full HKEX analysis history.