HSBC Stock Technicals Today: Gains 1.62%, Momentum Weakens
On September 1, 2026: price 1,528.40 GBp, trend sideways, RSI 53.0, support 1,497.20, resistance 1,597.40. technical analysis of hsbc stock.
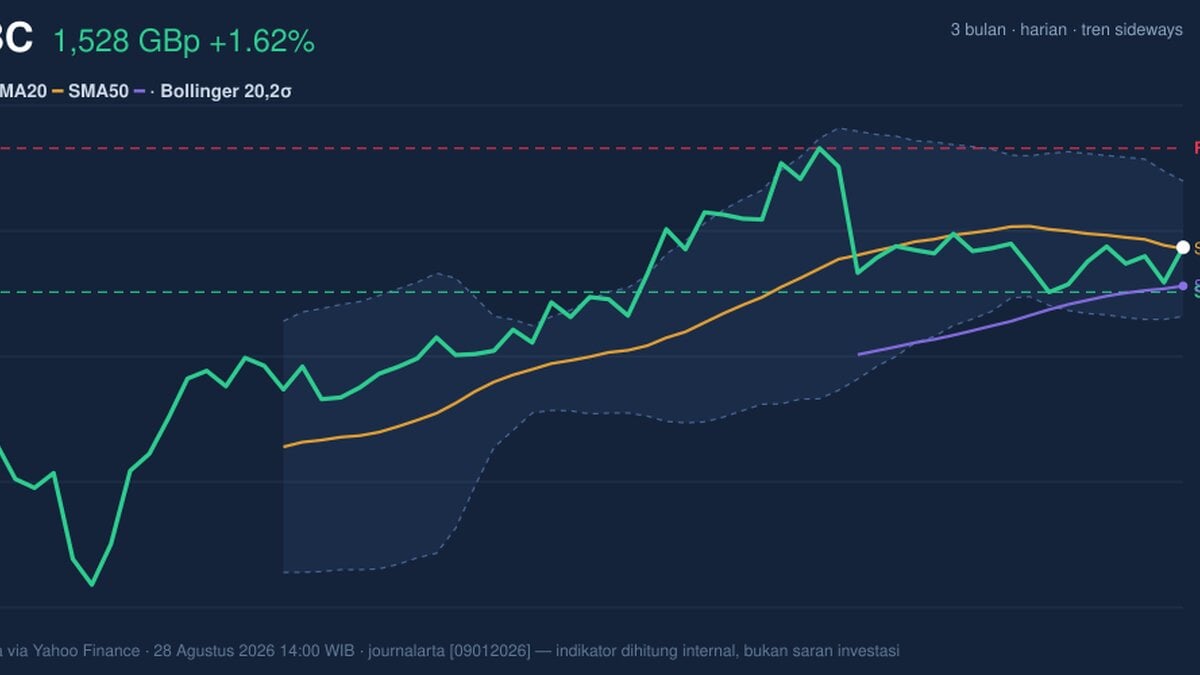
HSBC Holdings’ London-listed shares rose 1,528.40 GBp on 28 August 2026, up from a previous close of 1,504.00 GBp, putting the stock back above its short-term average even as the broader pattern remains sideways. That matters because the move is not a clean breakout: it is a recovery into the middle of a tightening range, where price often pauses before either extending or fading. The chart shows a market that is holding up, but not yet proving a new trend.
Trend & Price Action
The first signal to watch is that HSBC is now trading above its SMA20 at 1,527.47 and also well above the SMA50 at 1,501.50. In plain language, the share price is sitting above both its short- and medium-term trend markers, which usually tells traders that buyers have regained some control after the recent softness. But the slope of the SMA20 is still negative at -0.68% over 5 days, so the short-term trend line itself is still drifting lower. That combination — price above the average, but the average still falling — is typical of a market trying to stabilize rather than one already in a decisive uptrend.
There is also no fresh MA cross, which means the chart lacks the kind of moving-average confirmation that often accompanies a stronger directional phase. The stock’s 1-month change of -3.02% reinforces that this is still a repair job, not a clean momentum story. As shown in the chart, HSBC is trading near the middle of the recent band rather than pressing the top of it.
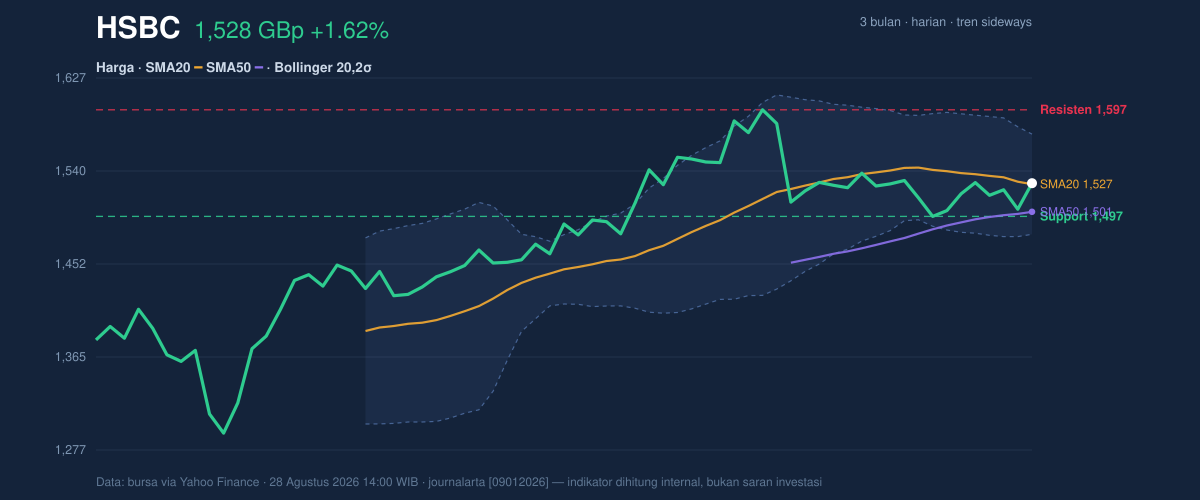
The current price sits at about 31% of the 20-hour range, which is a useful clue: it is not stretched near resistance, but it is also not deep enough into support to suggest panic selling. That positioning often signals indecision, especially when the range itself is becoming tighter.
Oscillators & Momentum
The momentum indicators are mixed, and the mix matters. RSI(14) at 53.0 is neutral, which means the stock is neither overbought nor oversold. In practical terms, this leaves room for movement in either direction, but it does not provide a strong directional edge on its own. The Stochastic %K at 66.3 versus %D at 45.5 is also neutral, though the faster line being above the slower one suggests short-term momentum has improved from earlier weakness.
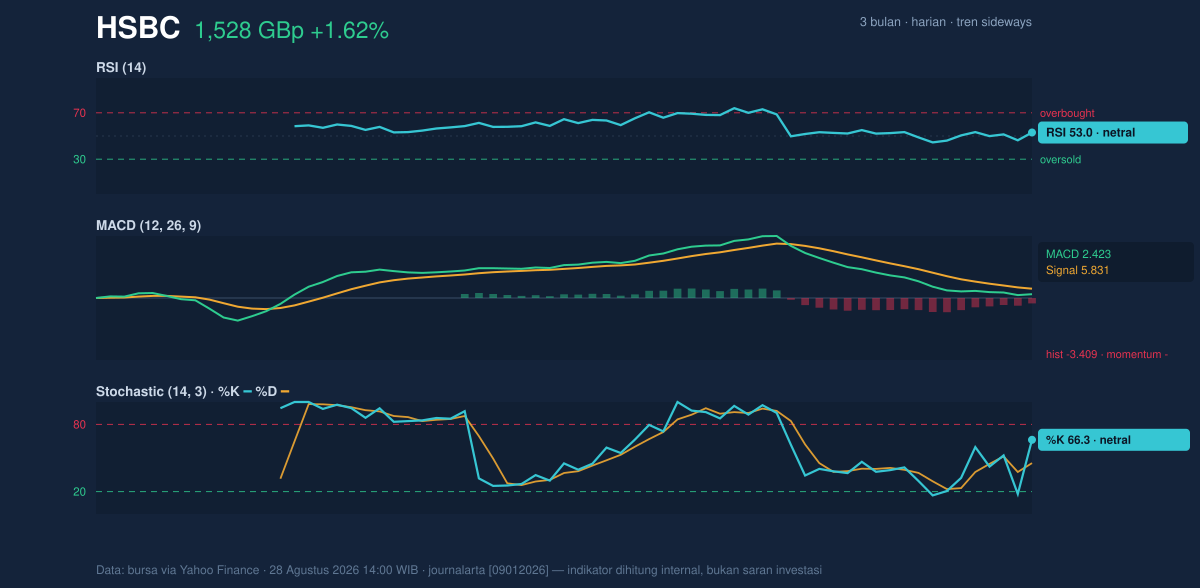
The more important warning comes from the MACD at 2.423 below its signal line at 5.831, with a histogram of -3.409. MACD is a trend-following momentum tool, and when the histogram turns negative it usually means upward price pressure is losing force, even if the share price is still holding up. That is the key signal here: HSBC has bounced, but momentum has not fully confirmed the bounce. In other words, the stock is better described as stabilizing than accelerating.
Volatility & Volume
Volatility is moderate, with ATR(14) at 23.41, or about 1.5% of price. ATR measures the average daily movement, so this tells readers the stock is not in a wild swing phase; it has enough movement to matter, but not enough to imply disorder. More interesting is the Bollinger setup. The upper band is 1,574.56, the middle band is 1,527.47, and the lower band is 1,480.38, with %B at 51% and the band width at 6.2%. A narrowing band is often read as a squeeze, meaning the market is compressing and may be building pressure for a larger move. That does not tell direction, but it does tell readers to expect the range to matter more than usual.
Volume supports the idea that the latest move is being accepted, if only cautiously. The latest volume of 26,653,122 is roughly 1.0× normal versus the 20-hour average of 26,397,575, so the rally is not a low-liquidity bounce. The OBV is rising, which is important because on-balance volume tracks whether money flow is accumulating behind the price. Rising OBV while price holds above the averages suggests participation is improving, even though the momentum oscillators are not yet fully aligned.
Key Levels & Scenarios
The nearest support is 1,497.20, while resistance stands at 1,597.40. Those levels are the clearest map for the next phase. If HSBC stays above support and starts pressing toward the upper Bollinger band at 1,574.56, the chart would begin to look more constructive, especially if MACD starts to close the gap with its signal line. If it fails to hold the 1,497.20 area, the recent recovery loses shape and the market risks slipping back toward the lower band at 1,480.38.
The broader backdrop also matters: the stock is below its 3-month high of 1,610.00 but well above its 3-month low of 1,267.20. That places HSBC in the upper half of its recent three-month range, which is a sign of resilience, but not yet of full trend recovery.
Technical Verdict: HOLD (wait & see)
HOLD (wait & see)
- RSI at 53.0 and Stochastic at 66.3/45.5 are neutral, so momentum is not strong enough to confirm a clean directional break.
- MACD histogram at -3.409 is negative, showing the bounce has not yet been fully validated by trend momentum.
- Price above SMA20 and SMA50, with OBV rising, suggests the market is stabilizing, but the negative SMA20 slope keeps the short-term picture mixed.
Verdict invalidated if price breaks below 1,497.20.
- Ideal Entry Range: 1,497.20 to 1,527.47
- Exit Target: 1,574.56 to 1,597.40
- Stop Loss protection: below 1,480.38
For non-traders, this means HSBC is holding up, but the chart still needs proof before the bounce can be treated as something stronger.
Latest 3-month high: 1,610.00.
Summary Data HSBC
| Last price | 1,528.40 GBp |
| Change 1 day / 5 days / 1 month | 1.62% / 0.66% / -3.02% |
| Trend / MA-cross | sideways / none |
| SMA20 / SMA50 | 1,527.47 / 1,501.50 |
| RSI (14) / Stochastic %K | 53.0 / 66.3 |
| Bollinger %B / ATR | 51% / 23.41 |
| Support / Resistance 20 days | 1,497.20 / 1,597.40 |
| Data as of | 28 Agustus 2026 14:00 WIB |
Track HSBC share price daily: live levels, support/resistance and our full HSBC analysis history.