PG Momentum Gains: Stock Gains 1.38% (September 1, 2026)
On September 1, 2026: price 145.12 USD, trend sideways, RSI 49.5, support 142.97, resistance 148.01. technical analysis of pg stock. PG Momentum Gains — full…
At US$145.12, Procter & Gamble is trading almost exactly on its SMA20 at US$145.05, a sign the stock is still in a holding pattern rather than a clean uptrend or downtrend. The move was modestly positive on the day, with the share price up 1.38% versus the previous close, but the broader setup remains sideways as the 20-day average is still edging lower. That combination matters: price sitting on the short-term average usually signals balance between buyers and sellers, while the weaker SMA50 at US$147.09 shows the medium-term trend has not yet fully repaired.
Trend & Price Action
The chart shows PG trading in the middle of its recent range, with the stock positioned at 43% of the 20-hour range and still below the 20-hour resistance at US$148.01. Support sits at US$142.97, close enough to matter if momentum fades. The fact that price is above the SMA20 but below the SMA50 is a classic neutral-to-cautious setup: short-term traders are getting some stability, but longer-term participants have not yet confirmed a stronger trend. No fresh moving-average crossover is in place, so the chart lacks the kind of signal that often marks a decisive change in direction.
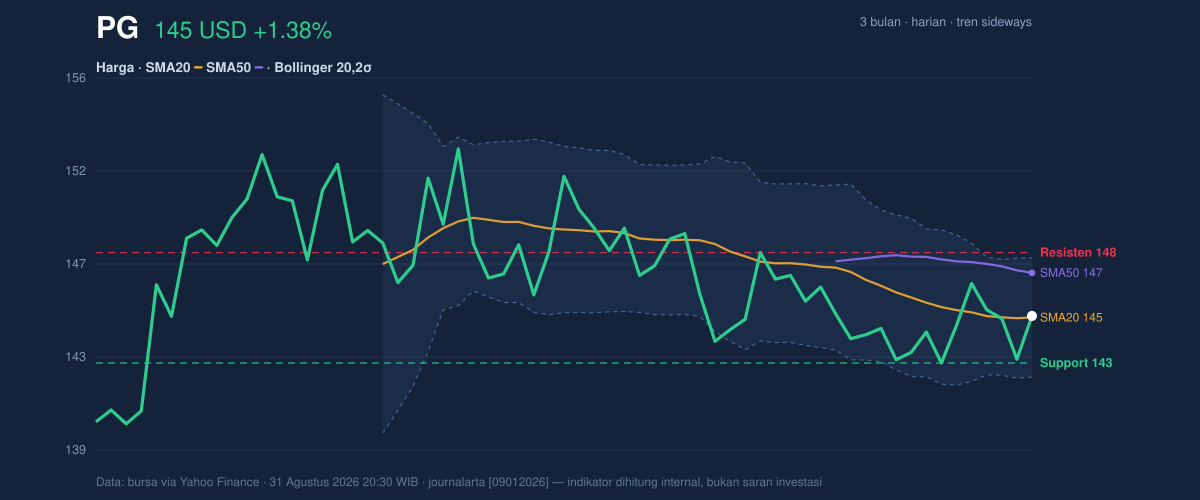
That leaves the stock in a narrow corridor. The 3-month range of US$138.86 to US$154.32 shows PG is neither near panic lows nor close to a full recovery high, which fits the current sideways tone. In plain language, the market is waiting for a catalyst. Until price can push convincingly through resistance, the chart still looks like consolidation rather than expansion.
Oscillators & Momentum
The momentum tools are mixed, but not broken. RSI at 49.5 is neutral, meaning the stock is neither overbought nor oversold; that often happens when a market is searching for direction rather than already committed to one. The Stochastic at 63.9 / 48.9 is also neutral, though the gap between %K and %D suggests the shorter-term line is ahead of the slower line, which can hint at improving near-term momentum without yet confirming a breakout. The most constructive signal is from MACD at -0.618 versus its signal line at -0.719, with a positive histogram of 0.101. That tells readers the stock is still below the zero line, so the trend is not outright strong, but the gap indicates upward momentum is building from a weak base.
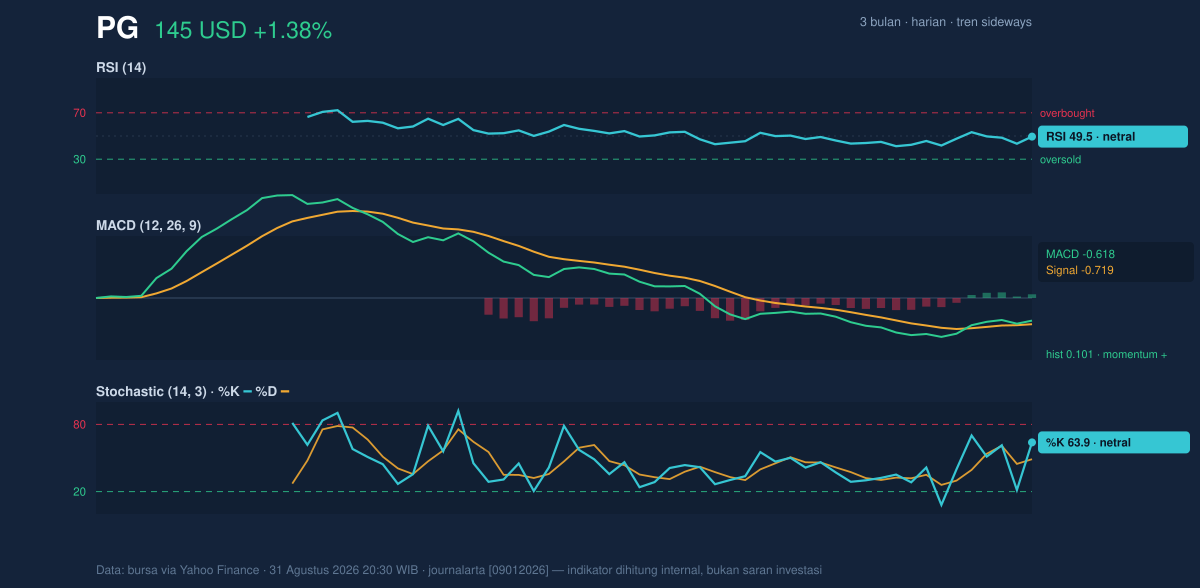
This matters because momentum is not just about direction; it is about whether price movement is gaining energy or losing it. Here, the oscillators are not screaming reversal, but they do show that the recent lift is more than random noise. The signal is still early, though, and early signals can fade quickly if price stalls under resistance.
Volatility & Volume
Volatility is subdued. ATR(14) at 2.16, or 1.5% of the share price, indicates relatively low day-to-day movement. That tends to compress trading ranges and can make breakouts more meaningful when they finally arrive. The Bollinger Bands reinforce that view: the stock is sitting near the middle band at US$145.05, with %B at 51%, essentially the midpoint between the upper band at US$147.78 and the lower band at US$142.32. The band width of 3.8% is narrow and described as a squeeze, which often means the market is storing energy for a larger move. A squeeze does not tell direction by itself; it tells readers that the current calm may not last.
Volume adds a constructive layer. The latest print of 12,097,900 shares is about 1.3× the 20-day average of 9,302,180, and OBV is rising. On a chart, that combination suggests participation is improving rather than fading. In technical terms, rising volume alongside a higher close is healthier than a price drift on thin trading, because it implies more investors are involved in the move. The key question is whether that participation is enough to force price through the ceiling at US$148.01.
Key Levels & Scenarios
As shown in the chart, the immediate battle is between support at US$142.97 and resistance at US$148.01. A move above resistance would put the stock closer to the upper Bollinger band at US$147.78 and would be more convincing if volume stays above average. If price fails to hold the US$142.97 area, the lower Bollinger band at US$142.32 becomes the next technical reference, and that would weaken the current stabilization story. Because the stock is already above SMA20 but still below SMA50, the path of least resistance is not yet fully established: a break above the recent ceiling would improve the structure, while a slip back under support would restore pressure.
Technical Verdict: HOLD (wait & see)
HOLD (wait & see) because the chart is balanced: price is above SMA20 but below SMA50, RSI is neutral at 49.5, and MACD is improving but still negative. The Bollinger squeeze and rising OBV argue that a larger move may be forming, but direction is not confirmed yet. This verdict is invalidated if price falls below US$142.97, which would weaken the support base and shift the setup back toward downside pressure.
- Ideal Entry Range: US$142.97 to US$145.05
- Exit Target (Target Price): US$147.78 to US$148.01
- Stop Loss protection: below US$142.32
For non-traders, this means PG is moving sideways with a slight improvement in momentum, but it has not yet proven that the next decisive move is higher.
Latest fact: volume reached 12,097,900 shares versus a 20-day average of 9,302,180, while OBV continued to rise.
Summary Data PG
| Last price | 145.12 USD |
| Change 1 day / 5 days / 1 month | 1.38% / 0.30% / 0.44% |
| Trend / MA-cross | sideways / none |
| SMA20 / SMA50 | 145.05 / 147.09 |
| RSI (14) / Stochastic %K | 49.5 / 63.9 |
| Bollinger %B / ATR | 51% / 2.16 |
| Support / Resistance 20 days | 142.97 / 148.01 |
| Data as of | 31 Agustus 2026 20:30 WIB |
Track PG stock price daily: live levels, support/resistance and our full PG analysis history.



