QCOM Stock Analysis: Gains 3.46%, Testing Key Resistance
On September 1, 2026: price 170.48 USD, trend sideways, RSI 54.9, support 151.57, resistance 170.48. technical analysis of qcom stock. QCOM Stock Analysis —…
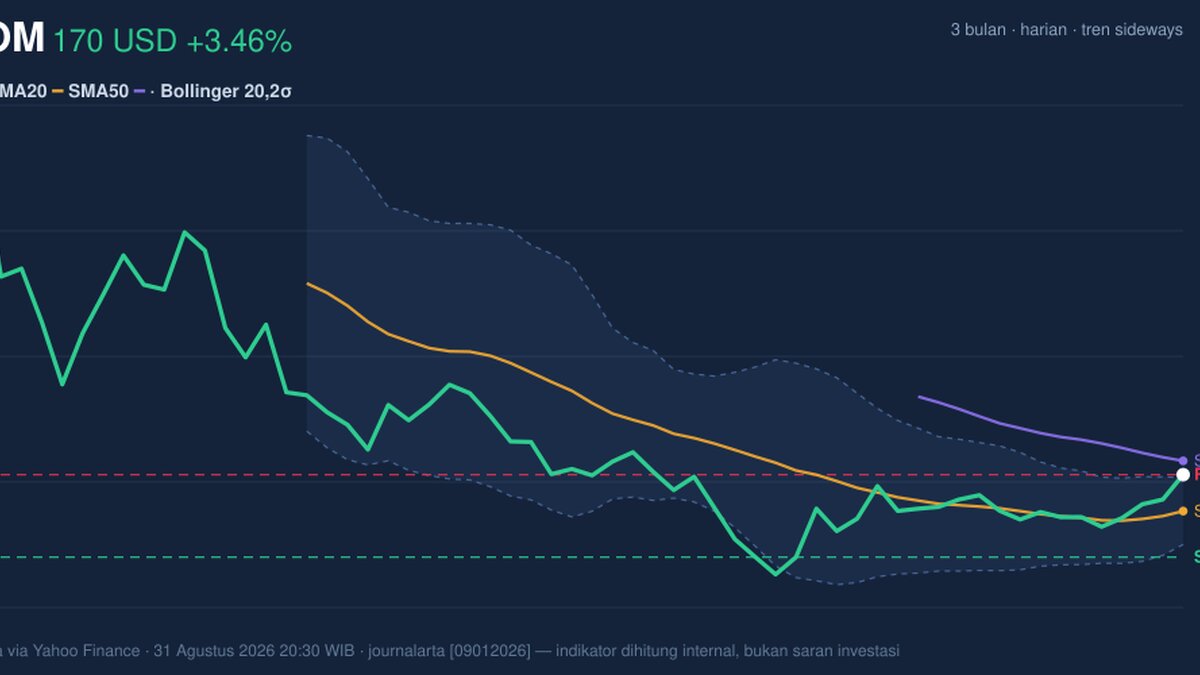
Qualcomm Inc. rose to $170.48 on NASDAQ, extending a 3.46% one-day gain and pushing the stock to the top of its recent trading band, according to Yahoo Finance data for 31 August 2026 20:30 WIB. The move matters because it came with volume at 1.3× normal and a rising OBV, which suggests the advance was backed by participation rather than a thin, one-off squeeze.
Trend & Price Action
The stock is still described as sideways, but the short-term tape has improved. Qualcomm is trading above its SMA20 at $162.12, while the SMA50 sits higher at $173.64, which tells readers the shares have recovered the near-term trend but have not yet reclaimed the broader intermediate trend line. In plain language, the market has pushed up from the recent average, but the longer reference point is still overhead and acts like a ceiling until it is cleared.
That matters because a sideways trend with a rising short average often reflects a market that is building energy rather than committing to a full breakout. The SMA20 slope of 0.94% over 5 days shows that the short-term base is tilting upward, but the absence of a new MA-cross means the chart has not yet produced a clean trend reversal signal. As shown in the chart, the price is now pressing against the upper edge of the Bollinger structure, which usually means strength is being tested rather than confirmed.
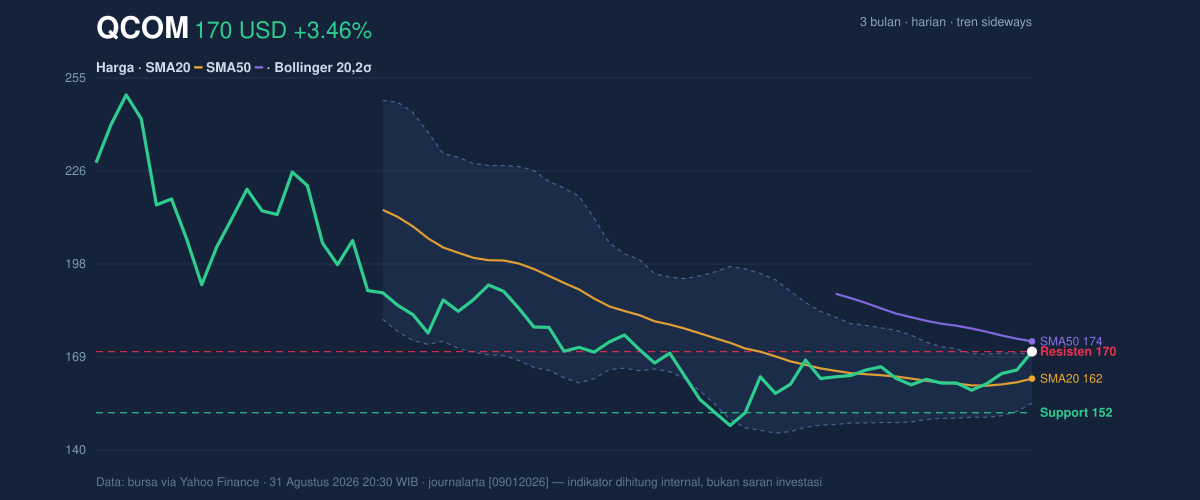
The latest close also sits at the 100% point of the 20-hour range, with support at $151.57 and resistance at $170.48. That positioning signals that the stock has used up the available room inside the short-term range and now needs either follow-through or consolidation. A move from the middle of a range to the top of it often says more about momentum than about valuation: buyers are in control for now, but they are also running into the market’s first real test.
Oscillators & Momentum
The oscillator picture is mixed, and that mix is important. RSI at 54.9 is neutral, which means the stock is neither stretched on the upside nor washed out on the downside. By itself, that would imply balance. But Stochastic %K at 94.1 and %D at 73.7 show the stock is overbought, meaning recent gains have been fast enough to leave the short-term price action extended. Overbought does not automatically mean reversal; it means the stock may need to pause, digest, or at least cool off before another leg higher can develop.
The momentum engine is still positive underneath that overbought reading. MACD at -2.235 remains below zero, but the signal line at -4.101 is lower still, leaving a positive histogram of 1.866. That combination signals improving momentum: the trend measure is still technically negative, yet the rate of change is improving and the gap versus the signal line is working in the stock’s favor. In practical terms, the chart is saying “better,” not “fully repaired.”
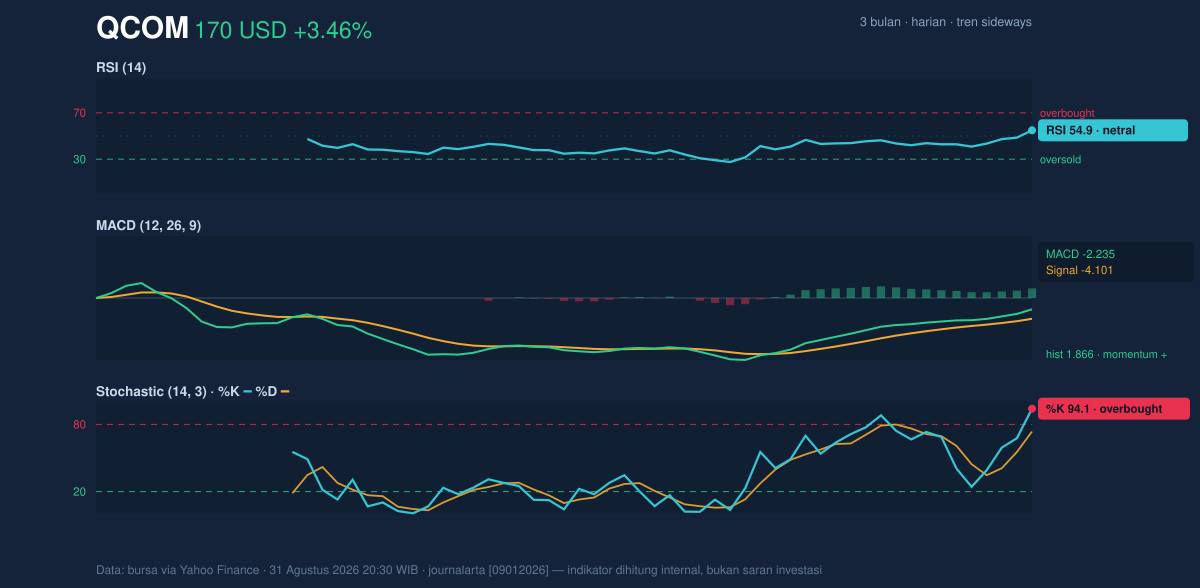
This is why the current setup is more nuanced than a simple breakout story. The oscillators are not all aligned: RSI is steady, Stochastic is hot, and MACD is improving. That often happens when a stock is climbing out of a range quickly. The result can be constructive, but it also raises the odds of near-term hesitation.
Volatility & Volume
Volatility is moderate rather than explosive. ATR(14) at 4.83, or 2.8% of price, indicates the stock is moving enough to create meaningful daily swings, but not so much that the chart is in panic mode. The Bollinger band width of 9.4% is described as normal, which means the stock is not in a squeeze that typically precedes a violent expansion, nor is it in an unusually stretched volatility phase. The important detail is that %B at 105% places the price above the upper Bollinger band at $169.77. That is a classic sign of strength, but also of extension.
The volume pattern supports the move. 12,734,600 shares traded versus a 20-day average of 9,947,805, and OBV is rising. Rising volume with rising OBV usually means accumulation is taking place, or at minimum that buyers are willing to pay up on the move. That is a healthier signal than a price rise on fading turnover. Still, because the stock is now above the upper band, the market is also telling us that enthusiasm has outpaced the average pace of trading.
Key Levels & Scenarios
The chart’s key decision points are straightforward. $170.48 is the immediate ceiling by definition of the latest print, while $173.64 is the more important overhead reference because it marks the SMA50. If the stock can hold above the upper Bollinger band and push through the 50-day average, the next signal would be that the recent rebound is graduating from a short-term bounce into a more durable recovery attempt. If it fails, the most visible pullback zone is the $162.12 SMA20, with the deeper structural floor at $151.57.
The 3-month range adds context: the stock has traveled a long way from the $142.89 low, but remains far below the $255.09 high. That distance means the chart is not near a long-term exhaustion point, yet it also reminds readers that the recent rally is still working inside a much larger range.
Technical Verdict: HOLD (wait & see)
HOLD (wait & see)
- RSI at 54.9 is neutral, so the stock is not giving a clean momentum reset.
- MACD histogram at 1.866 is positive, which supports the rebound, but the MACD line at -2.235 is still below zero.
- %B at 105% and Stochastic %K at 94.1 show the move is extended near the upper Bollinger band, raising the odds of a pause.
- Verdict invalidated if price falls below $162.12, the SMA20 and middle Bollinger band.
- Ideal Entry Range: $162.12 to $169.77
- Exit Target: $173.64
- Stop Loss: below $154.47
For non-traders: the chart is stronger than it was, but it is already stretched, so it needs to prove the move before the next step is trusted.
Last fact: Qualcomm closed at $170.48, just above the upper Bollinger band at $169.77.
Summary Data QCOM
| Last price | 170.48 USD |
| Change 1 day / 5 days / 1 month | 3.46% / 6.05% / 15.49% |
| Trend / MA-cross | sideways / none |
| SMA20 / SMA50 | 162.12 / 173.64 |
| RSI (14) / Stochastic %K | 54.9 / 94.1 |
| Bollinger %B / ATR | 105% / 4.83 |
| Support / Resistance 20 days | 151.57 / 170.48 |
| Data as of | 31 Agustus 2026 20:30 WIB |
Track QCOM stock price daily: live levels, support/resistance and our full QCOM analysis history.



