Shell Stock Gains 1.01% Today, Momentum Weakens
On September 1, 2026: price 3,344.50 GBp, trend sideways, RSI 53.0, support 3,277.50, resistance 3,440.00. technical analysis of shell stock.
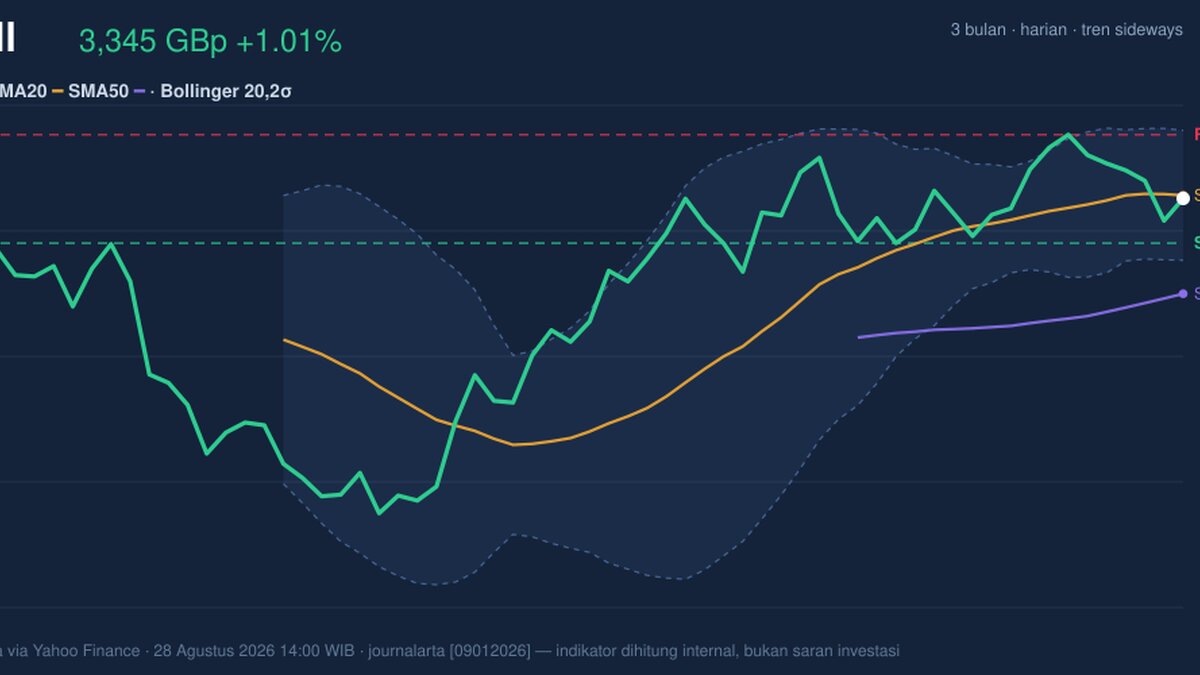
Shell plc edged higher on the London Stock Exchange on 28 August 2026, with the shares finishing at 3,344.50 GBp, up 1.01% on the day, even as the broader tape still points to a stock that is moving sideways rather than breaking cleanly in either direction. The gain matters less as a standalone move than as a test of whether buyers can keep price close to the mid-range and away from the lower half of the recent band, because Shell is still trading below its SMA20 at 3,349.10 while remaining comfortably above the SMA50 at 3,201.57.
Trend & Price Action
The chart shows a market that is neither trending strongly up nor rolling over, but pausing in a narrow corridor. That is what the sideways trend and the modest SMA20 slope of 0.41% over five days are signalling: the short-term average is still rising, but only gently, which usually means conviction is thin and price is waiting for a catalyst. Shell’s last price sits just under the 20-day average, a small but important detail, because being below the short-term trend line suggests the latest bounce has not yet fully reclaimed momentum.
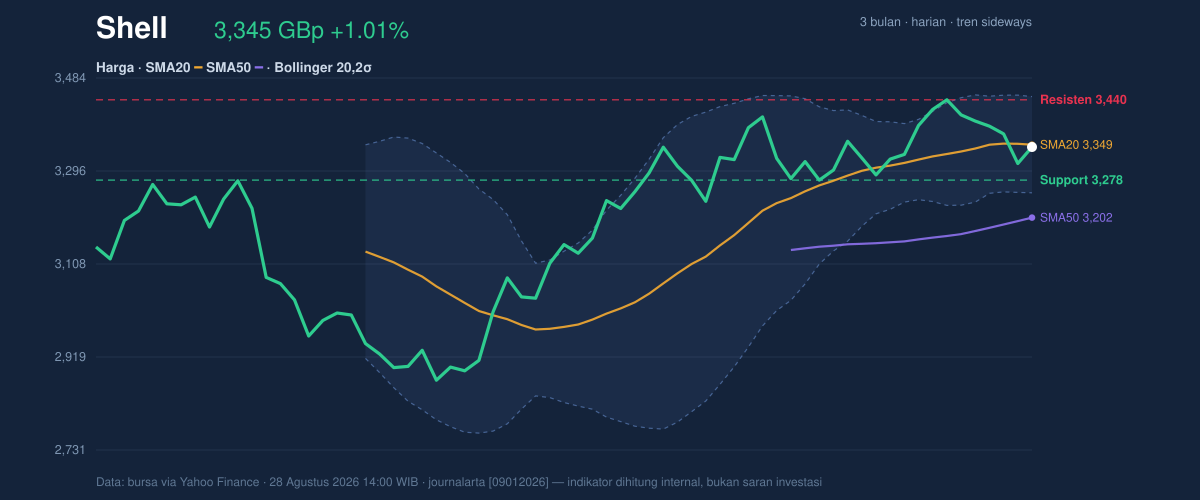
The wider structure is more constructive than the day-to-day noise implies. Price is still well above the 50-day average, and that gap tells readers the medium-term trend has not broken down. At the same time, the stock is trading at 41% of its 20-day range, which places it in the lower-middle part of the recent band rather than near the ceiling. The 20-day Bollinger band gives that picture more texture: Shell is sitting between the upper band at 3,446.50 and the lower band at 3,251.70, with the middle line at 3,349.10. In plain terms, the shares are hovering around the balance point, not stretched enough to look overheated and not weak enough to look washed out.
The 3-month range also frames the story. Shell is trading far above the 3,758.50 three-month high? No — it is below that level, and still above the 2,559.50 three-month low, which leaves ample room in both directions. That distance from the extremes is consistent with a stock that has cooled from earlier strength and is now searching for direction.
Oscillators & Momentum
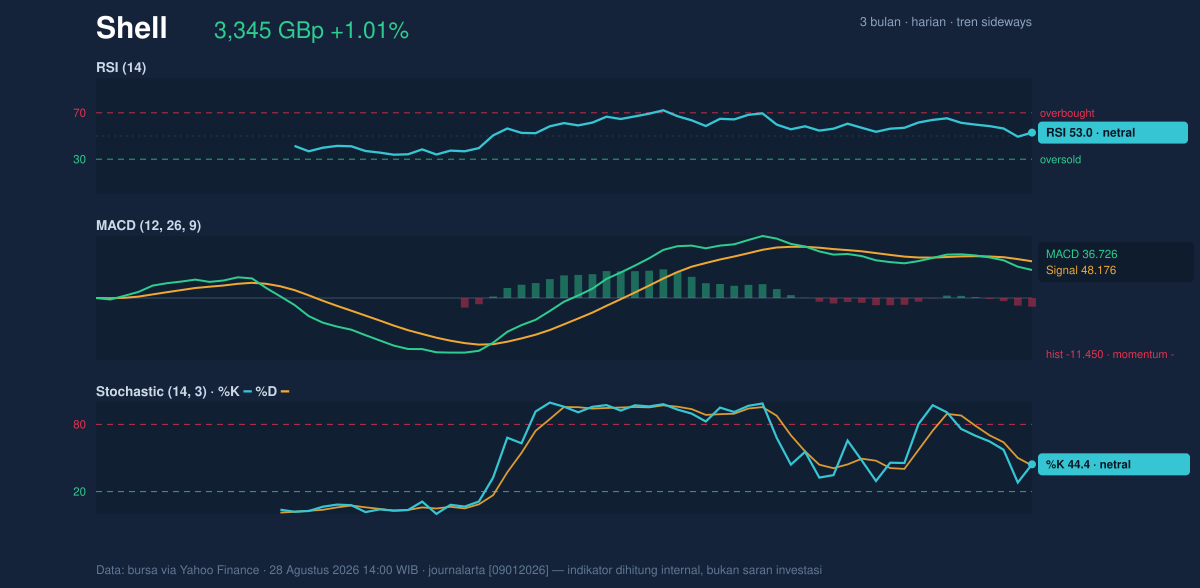
Momentum indicators are mixed, and that mix is the main reason the setup reads as neutral rather than decisively bullish. The RSI at 53.0 is near the middle of its scale, which usually means neither buyers nor sellers have a clear emotional edge. The Stochastic %K at 44.4 and %D at 43.3 also sit in neutral territory, reinforcing the idea that Shell is not in an overbought surge or an oversold washout. For general readers, these oscillators are basically measuring whether price has moved too far, too fast; here, they say “not yet.”
The more important signal is coming from MACD, which is still negative. Shell’s MACD at 36.726 sits below the signal line at 48.176, leaving a histogram of -11.450. That gap means recent price action is lagging the trend signal, a sign that upside momentum has not fully reasserted itself. In practical terms, the stock can still rise, but the current move lacks the kind of internal strength that usually accompanies a clean breakout. The mismatch between a neutral RSI and a negative MACD often appears when a stock is stabilising after a pullback, but has not yet proven that the rebound can extend.
Volatility & Volume
Volatility is present, but not extreme. The ATR of 51.82, equal to 1.5% of price, suggests a normal daily swing range for a large-cap energy name rather than a disorderly market. That matters because it means price can move meaningfully without needing a dramatic news event; Shell can still test levels quickly if flows shift.
The Bollinger bands are telling a subtler story. The band width is only 5.8%, and the squeeze suggests compression, which often precedes a larger move. Compression does not predict direction on its own, but it does mean the current calm may not last. With price sitting near the middle of the band and %B at 48%, Shell is not pressing the upper edge or the lower edge. That usually leaves the market vulnerable to a directional break once buyers or sellers tip the balance.
Volume adds a slight positive note, but not a decisive one. The latest turnover of 9,858,273 was about 1.1x the 20-day average of 9,182,790, which shows participation was a bit firmer than normal. Yet OBV is falling, and that divergence matters: on-balance volume tracks whether money flow is accumulating or leaving the stock. A rising price with falling OBV can mean the bounce is not being broadly supported, so the move may be vulnerable unless volume improves on further gains.
Key Levels & Scenarios
The immediate map is clear. Support at 3,277.50 is the first line that matters, because it sits below the current price and near the lower part of the recent range. If Shell holds above that zone, the market can continue to treat the recent dip as a consolidation rather than a breakdown. On the upside, resistance at 3,440.00 and the upper Bollinger band at 3,446.50 form a tight ceiling. A push through that area would be the first sign that the squeeze is resolving in favour of buyers.
If price fails to hold 3,277.50, the chart would likely shift from sideways consolidation into a deeper retracement, especially because OBV is already weakening. If price clears 3,440.00 with better volume, the negative MACD would be challenged and the stock could start to rebuild trend credibility. Until then, Shell remains in a balancing act between a supportive medium-term trend and a hesitant short-term momentum profile.
Technical Verdict: HOLD (wait & see)
HOLD (wait & see) is the cleanest technical reading because the chart is balanced: price is still above the SMA50 at 3,201.57, but it is below the SMA20 at 3,349.10; momentum is neutral on RSI 53.0 and Stochastic 44.4 / 43.3, while MACD remains negative; and the Bollinger squeeze at 5.8% suggests a move may be coming, but not yet in a confirmed direction.
- Ideal Entry Range: 3,277.50 to 3,349.10, where support and the short-term average converge.
- Exit Target: 3,440.00 to 3,446.50, aligned with resistance and the upper Bollinger band.
- Stop Loss protection: below 3,251.70, the lower Bollinger band, which would signal the range is failing.
- Verdict invalidated if price breaks above 3,446.50 with improving momentum, or falls below 3,251.70 and loses the squeeze structure.
For non-traders, this means Shell is not giving a clean directional signal yet, and the next decisive move matters more than today’s small gain.
“Until the band breaks, it’s a market that’s holding its breath.”
Summary Data Shell
| Last price | 3,344.50 GBp |
| Change 1 day / 5 days / 1 month | 1.01% / -1.91% / -1.15% |
| Trend / MA-cross | sideways / none |
| SMA20 / SMA50 | 3,349.10 / 3,201.57 |
| RSI (14) / Stochastic %K | 53.0 / 44.4 |
| Bollinger %B / ATR | 48% / 51.82 |
| Support / Resistance 20 days | 3,277.50 / 3,440.00 |
| Data as of | 28 Agustus 2026 14:00 WIB |
Track Shell share price daily: live levels, support/resistance and our full Shell analysis history.