Singtel Stock Gains 0.67% Today, Death Cross Pressure
On September 1, 2026: price 4.54 SGD, trend sideways, RSI 59.2, support 4.25, resistance 4.52. technical analysis of singtel stock. Singtel Stock Gains — full…
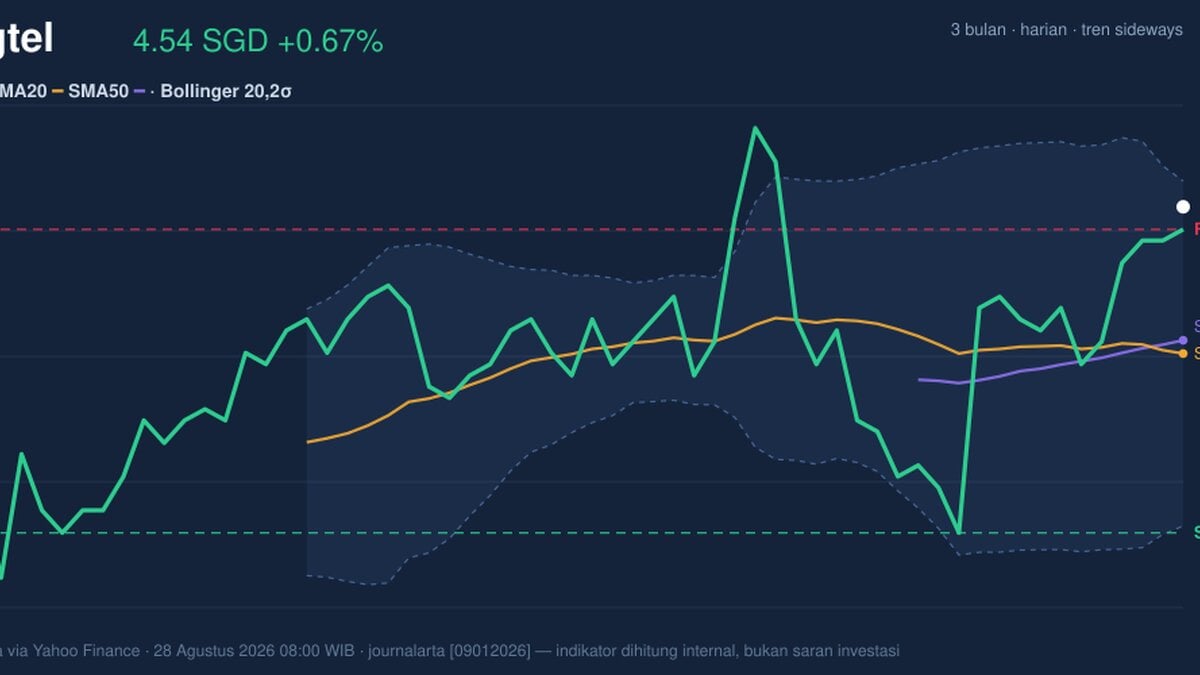
Singapore Telecom (Singtel) rose to SGD 4.54 on SGX on 28 August 2026, up from 4.51, as the counter pushed back above short-term averages even while the broader chart still points to a sideways market. The move matters because it places the stock near the top of its recent trading band, but not yet in clear breakout territory; in plain terms, buyers have regained control of the latest session, while the longer trend is still asking for proof.
Trend & Price Action
Singtel is now trading above its SMA20 at 4.41 and above its SMA50 at 4.42, which usually signals that the latest price action is firmer than the recent average. But the chart also shows a death cross, where the SMA20 has moved below the SMA50, and that is an important warning sign: it tells readers that the shorter trend has weakened enough to undercut the medium-term trend, even if the current price is still holding above both lines.
That tension is why the stock reads as sideways rather than decisively trending. The SMA20 slope of -0.09% over five days says momentum has not fully turned up yet. The price is also sitting at 107% of the 20-hour range, with support at 4.25 and resistance at 4.52, which means the latest close has already moved beyond the near-term ceiling. As shown in the chart, that puts the stock in a position where continuation is possible, but only if it can stay above the old resistance and convert it into support.
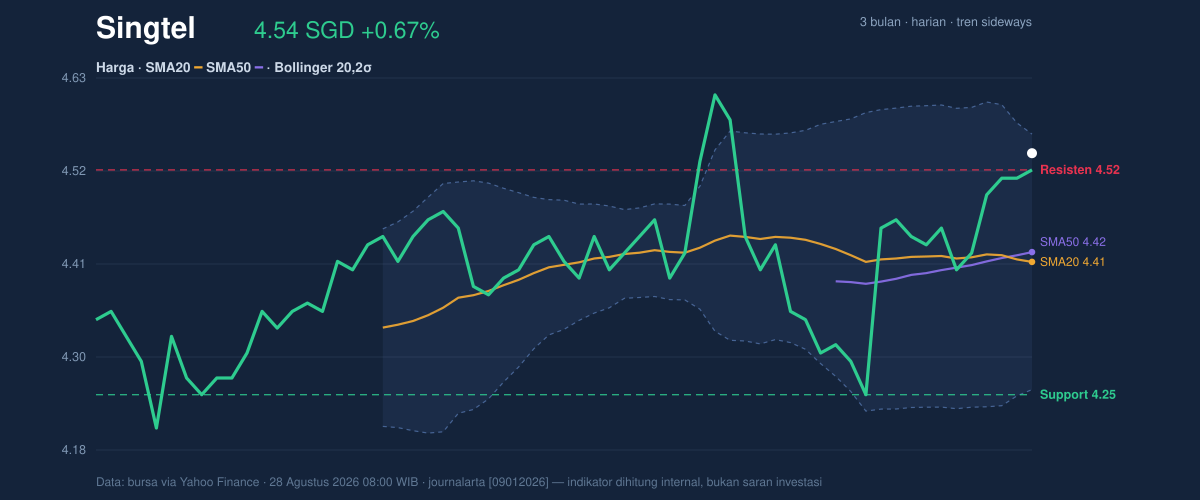
The broader range gives more context. Over the past three months, Singtel has traded between 4.70 and 4.15, so the current price is closer to the upper half of that corridor. That is constructive, but it is still below the 3-month high, which suggests the market has not yet fully priced in a stronger trend reversal.
Oscillators & Momentum
Momentum is mixed, and that mix is the heart of the current setup. The RSI at 59.2 is neutral, which means the stock is not stretched enough to imply an immediate reversal on its own. By contrast, the Stochastic %K at 94.3 and %D at 92.4 are both overbought, a signal that the recent lift has been fast enough to leave the short-term oscillator crowded at the top of its range.
That overbought reading does not automatically mean weakness. It often means the stock has been strong enough to run ahead of itself, which can produce either a pause or a brief pullback before the next move. The MACD is positive at 0.024, with the signal line at 0.009 and histogram at 0.015, so the trend impulse is still leaning upward underneath the overbought Stochastic reading. In other words, short-term speed is high, but the broader momentum engine has not yet rolled over.
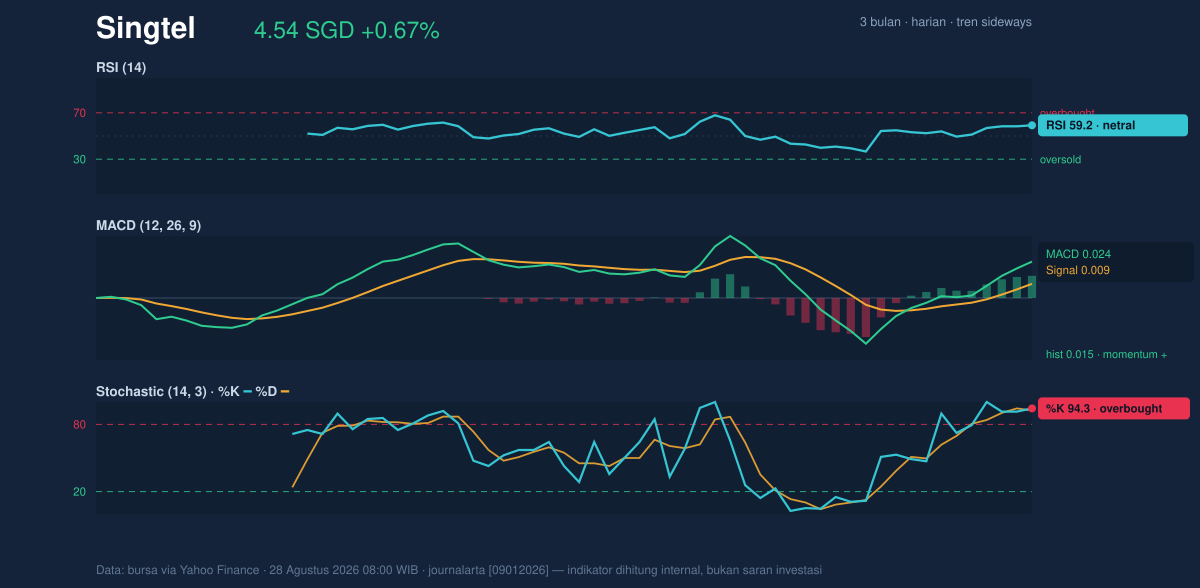
The combination is important: MACD positive while Stochastic is overbought often means the stock may keep rising if buyers remain active, but the margin for error is narrowing. For general readers, that is the difference between a healthy advance and an advance that may need to cool before it can continue.
Volatility & Volume
Volatility is not especially elevated, which leaves room for a clean move if volume arrives. The ATR(14) is 0.08, or about 1.7% of price, indicating moderate daily movement rather than a disorderly swing. At the same time, the Bollinger Bands are telling a more nuanced story: the upper band is 4.56, the middle band is 4.41, and the lower band is 4.26, while %B is 93%. That means the price is trading close to the top of its band structure, a sign of strength, but also a sign that the move is approaching the area where rallies often pause.
The band width at 7.0% is narrowing, which is a classic squeeze pattern. A squeeze does not predict direction by itself; it says volatility has compressed and a larger move may be building. In this case, the market is leaning upward because the price is pressing near the upper band, but the squeeze also means the next decisive move could come quickly if the stock clears the nearby ceiling or slips back toward the middle band.
Volume has not yet fully confirmed the push. The latest volume was 20,834,900, below the 20-session average of 26,817,354, or 0.8x normal. That suggests the advance is happening without broad participation, which weakens the conviction behind the move. Still, OBV is rising, and that matters because on-balance volume tracks whether money is generally flowing into the stock over time. Rising OBV alongside a higher price is a constructive sign that accumulation may be building even if the day’s turnover is not yet exceptional.
Key Levels & Scenarios
The market is now focused on whether 4.52 resistance can be held and then turned into a base. If that happens, the chart would start to look less like a rebound inside a range and more like a genuine attempt to challenge the upper Bollinger band at 4.56. A failure there would leave the stock vulnerable to a retreat toward 4.41, the Bollinger middle line and SMA20 area, where the market has been finding its balance.
The downside is equally clear. If price slips back below 4.25 support, the recent strength would lose its technical footing and the 3-month low at 4.15 would come back into view. Because the death cross is already in place, a loss of near-term support would reinforce the idea that the recent bounce is only a countertrend move inside a broader sideways structure.
Technical Verdict: HOLD (wait & see)
HOLD (wait & see)
- MACD is positive, so the underlying momentum is still constructive.
- Stochastic is overbought, which warns that the short-term move may be extended.
- Death cross and a slightly negative SMA20 slope show the broader trend has not fully repaired.
Verdict invalidated if price falls below 4.25.
- Ideal Entry Range: 4.41 to 4.52
- Exit Target: 4.56
- Stop Loss protection: below 4.25
For non-traders, this means the stock is firm enough to watch closely, but not yet clean enough to call a confirmed trend change.
The latest 3-month high for Singtel is 4.70.
Summary Data Singtel
| Last price | 4.54 SGD |
| Change 1 day / 5 days / 1 month | 0.67% / 3.18% / -0.87% |
| Trend / MA-cross | sideways / death |
| SMA20 / SMA50 | 4.41 / 4.42 |
| RSI (14) / Stochastic %K | 59.2 / 94.3 |
| Bollinger %B / ATR | 93% / 0.08 |
| Support / Resistance 20 days | 4.25 / 4.52 |
| Data as of | 28 Agustus 2026 08:00 WIB |
Track Singtel share price daily: live levels, support/resistance and our full Singtel analysis history.