T Testing Key Resistance: Stock Gains 1.81% (September 1, 2026)
On September 1, 2026: price 25.89 USD, trend uptrend, RSI 67.7, support 23.06, resistance 25.89. technical analysis of t stock. Testing Key Resistance — full…
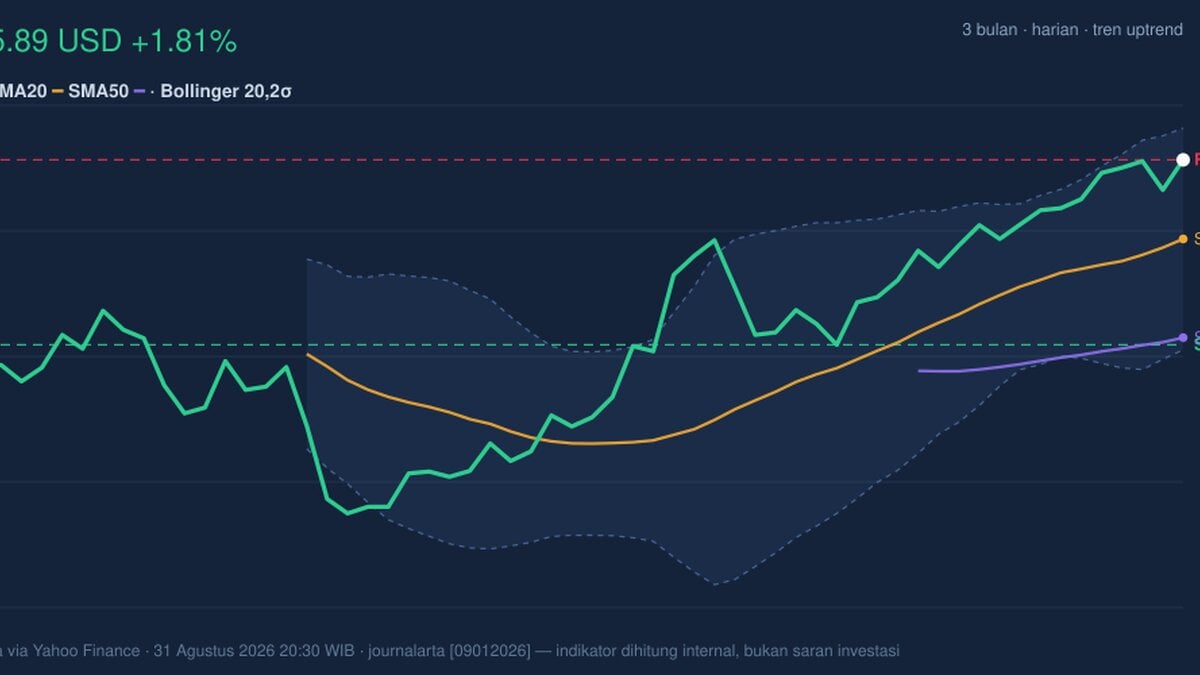
AT&T edged up to 25.89 USD, a 1.81% rise from the previous close, and the move matters because it pushed the stock to the top end of its recent trading range rather than simply adding another quiet session. The shares are now trading above the 20-day and 50-day simple moving averages, which tells investors the stock is not just bouncing — it is holding a short-term uptrend with enough follow-through to keep sellers from regaining control.
Trend & Price Action
The chart shows a stock that has been climbing with purpose, not speed. AT&T is above SMA20 at 24.68 and SMA50 at 23.17, a constructive setup that usually signals the market is willing to pay more today than it did over the past month or two. The SMA20 is rising 1.89% over five days, which is important because an upward slope means the recent advance is being sustained by actual trend improvement, not just a one-day spike.
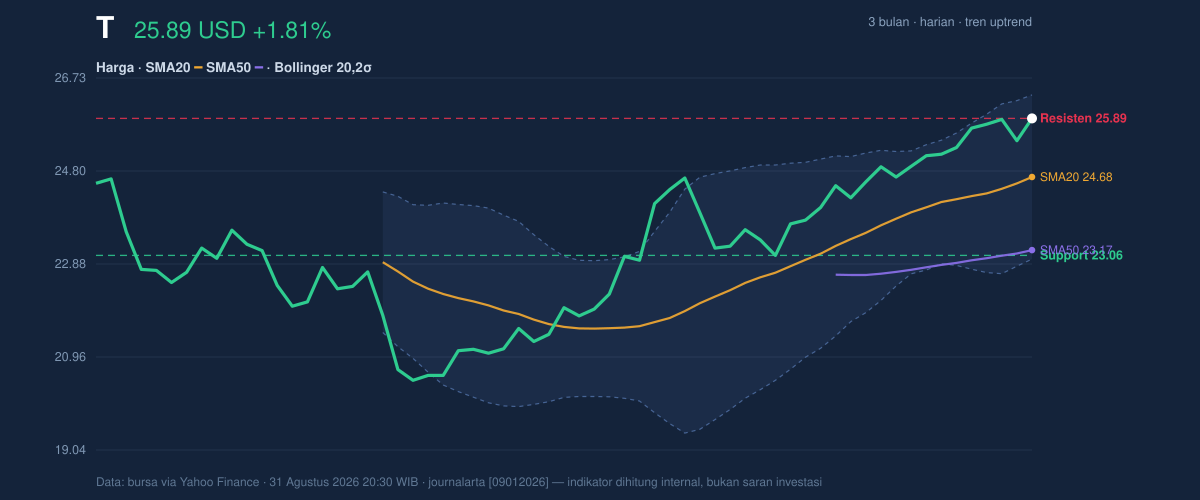
The shares are also sitting right at the upper edge of the observed range, with 20-hour resistance at 25.89 and the 3-month high at 26.24. That positioning matters: when price closes near the top of a range, it often shows buyers are still in charge, but it also means the market is closer to a zone where profit-taking can appear. The stock has gained 11.35% over one month, which reinforces that this is more than a brief reaction move.
The Bollinger bands add a second layer to that picture. Price is near the upper band at 26.38, with %B at 86%. In plain English, that means the stock is trading in the upper part of its recent volatility envelope, often a sign of strength — but also a sign that the move may be stretched in the short term. The band width of 13.7% is normal, so this is not a volatility shock; it is a steady advance moving toward the higher end of its usual swing.
Oscillators & Momentum
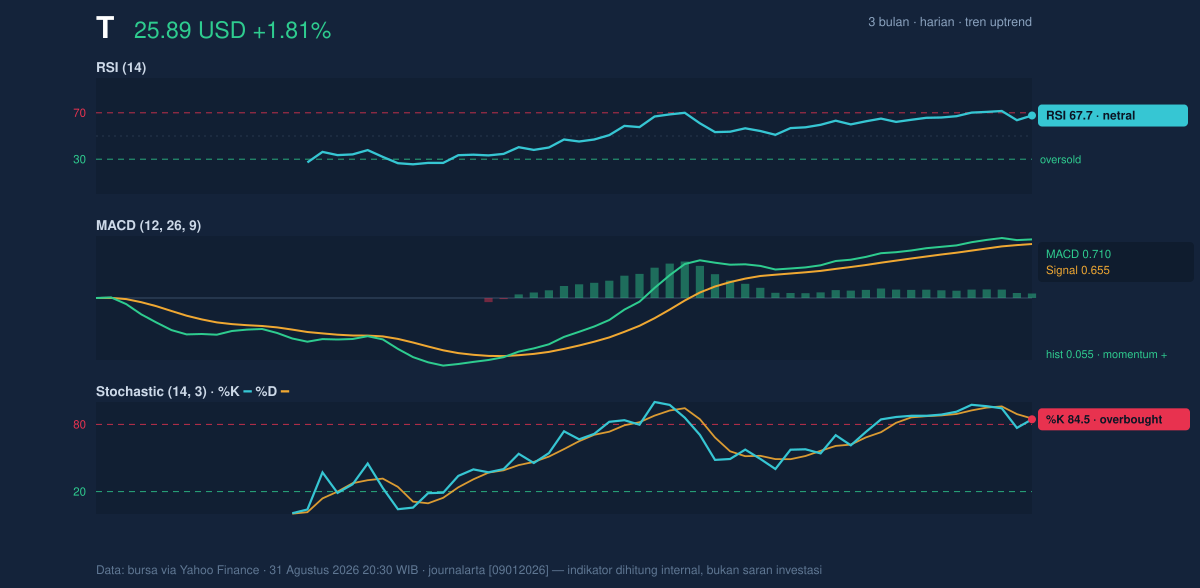
Momentum is positive, but it is no longer in the comfortable middle ground. The RSI at 67.7 is still described here as neutral, but it is close enough to the overbought threshold to suggest the stock is approaching a zone where upside can become harder to extend without a pause. That is a subtle but important distinction: RSI near 70 does not mean an automatic reversal, only that the pace of gains is becoming more mature.
The Stochastic %K at 84.5 and %D at 85.3 are both overbought, which means the stock has been closing near the top of its recent range for several sessions. This often confirms strength in the short run, but it also warns that the current rally may be vulnerable to a breather if fresh buying does not keep arriving. In other words, the market is still leaning bullish, but it is leaning forward.
The MACD at 0.710 above the signal line at 0.655, with a positive histogram of 0.055, is the clearest confirmation that trend momentum remains intact. MACD above signal line means the faster trend is still outperforming the slower one; the positive histogram means that gap remains in place. For readers, that is the technical equivalent of saying the stock still has a tailwind — just not an unlimited one.
Volatility & Volume
The move has not been driven by a thin market. Volume came in at 37,385,800, just above the 20-day average of 36,678,775, or about 1.0× normal. That matters because price gains backed by roughly average participation are more credible than gains on fading turnover. The OBV is rising, which suggests money flow has been trending in the same direction as price. When price advances and OBV rises with it, the move is usually being supported by accumulation rather than a short-lived squeeze.
ATR at 0.48, or 1.8% of price, points to moderate volatility. That is a useful signal because it suggests the stock is not in a disorderly move; instead, it is drifting upward with manageable daily swings. Combined with the normal Bollinger width, this implies the current trend has room to continue, but not in a straight line.
Key Levels & Scenarios
The key technical map is fairly clear. Support sits at 23.06, with the next important cushion coming from SMA20 at 24.68. As long as price remains above that moving average, the short-term trend stays constructive. On the upside, 25.89 is now the immediate resistance-turned-test point, and the next reference is the 3-month high at 26.24. A move through that area would signal that buyers are willing to pay beyond the recent ceiling, while failure to clear it could invite a pause or pullback toward the middle of the band.
The most important signal in the chart is not that AT&T is rallying; it is that the rally is still being confirmed by trend and volume even as oscillators start to look stretched.
Technical Verdict: HOLD (wait & see)
HOLD (wait & see)
- MACD remains positive, showing the short-term trend still has momentum behind it.
- Price is above SMA20 and SMA50, which keeps the broader short-term structure constructive.
- Stochastic is overbought and %B is 86%, so the stock is extended near the upper end of its range and may need consolidation.
Verdict invalidated if price falls below 23.06.
- Ideal entry range: 24.68 to 25.89
- Exit target: 26.24
- Stop loss protection: 23.06
In plain English: the stock still looks technically healthy, but it is close enough to a stretched zone that patience matters more than urgency.
“The rally is real, but it is now being asked to prove it can keep going above the old ceiling.”
Summary Data T
| Last price | 25.89 USD |
| Change 1 day / 5 days / 1 month | 1.81% / 2.37% / 11.35% |
| Trend / MA-cross | uptrend / none |
| SMA20 / SMA50 | 24.68 / 23.17 |
| RSI (14) / Stochastic %K | 67.7 / 84.5 |
| Bollinger %B / ATR | 86% / 0.48 |
| Support / Resistance 20 days | 23.06 / 25.89 |
| Data as of | 31 Agustus 2026 20:30 WIB |
Track T stock price daily: live levels, support/resistance and our full T analysis history.