Testing Key Resistance, CVX Stock Gains 2.12% Today
On September 1, 2026: price 206.14 USD, trend uptrend, RSI 65.7, support 186.41, resistance 206.14. technical analysis of cvx stock. Testing Key Resistance —…
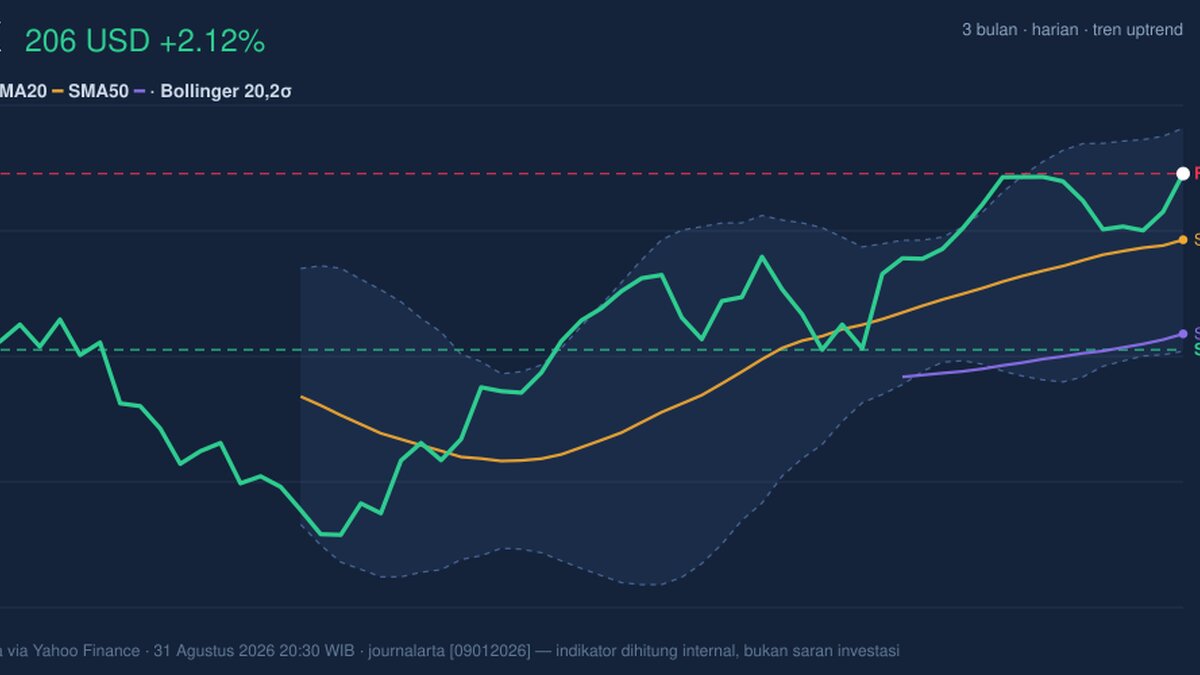
Chevron Corp. (NYSE: CVX) finished at 206.14 on the New York Stock Exchange, up 2.12% from the previous close of 201.86, and the move matters because it pushed the shares to the top of the 20-day range while also leaving them just below the upper Bollinger band, as shown in the chart. That combination says the stock is no longer drifting; it is being actively tested by buyers, but it is also approaching a zone where rallies often start to lose easy momentum.
Trend & Price Action
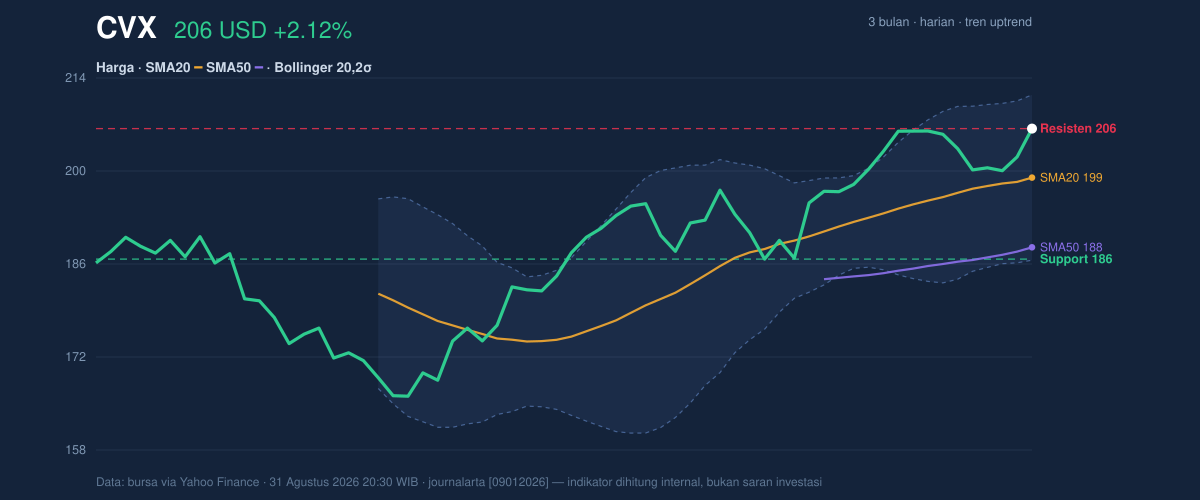
The broader structure remains constructive. Chevron is trading above SMA20 at 198.73 and well above SMA50 at 188.19, which means the shorter trend is still leading the medium-term trend. In plain language, the stock is not merely bouncing; it is holding above the levels that traders use to judge whether a move has staying power. The SMA20 slope of 1.17% over 5 days adds to that message: the 20-day average is rising, so the recent advance is being supported by an improving baseline rather than a single sharp day.
The absence of a fresh MA-cross is also telling. A moving-average crossover is often used to mark a major trend shift, but here the signal is less dramatic and more useful: Chevron has already moved into an established uptrend, and the market is now deciding whether that trend can extend beyond the current range. The shares are sitting at 100% of the 20-day range, with 20-day support at 186.41 and 20-day resistance at 206.14. That means the latest print is not far from a ceiling that has already been reached, which can invite either consolidation or a breakout attempt.
The three-month map sharpens that picture. Chevron’s 3-month high is 208.98 and the low is 164.78, so the stock is now trading close enough to the peak to suggest strength, but not so far above it that the move looks detached from recent history.
Short-term strength is real, but it is now being tested.
Oscillators & Momentum
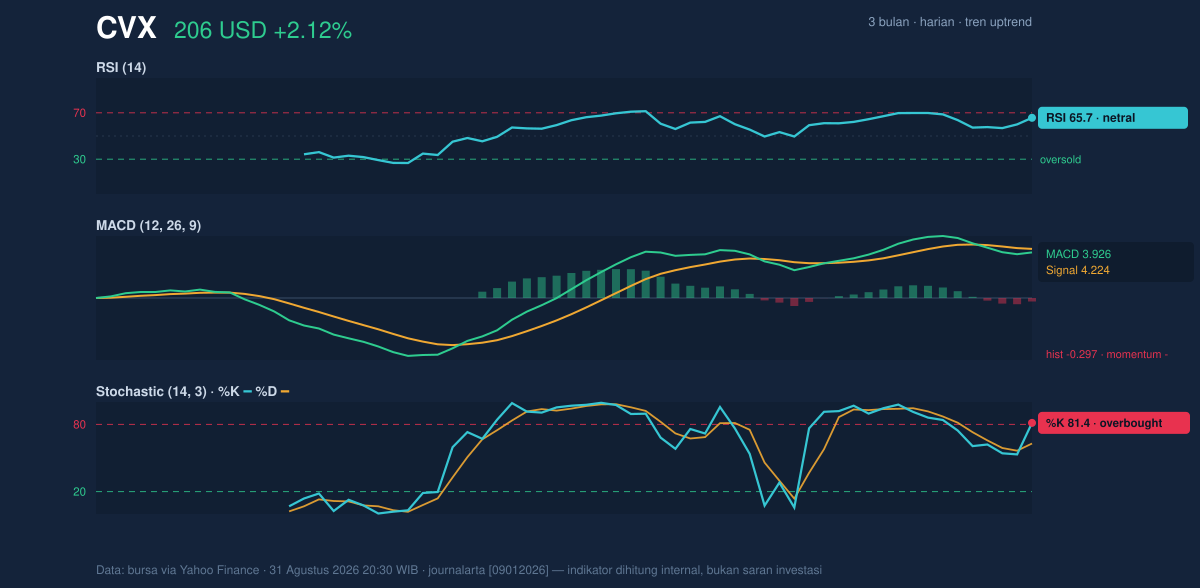
Momentum indicators are sending a more mixed message than the price trend. The RSI at 65.7 is described as neutral here, but it sits near the upper end of the usual comfort zone, which tells readers the stock has gained speed without yet entering a clearly stretched condition. The more important signal comes from Stochastic, where %K at 81.4 and %D at 62.9 point to an overbought reading. That does not mean the stock must reverse; it means recent closes have been clustering near the top of the range, often a sign of strong demand that can also become vulnerable if fresh buyers hesitate.
The MACD is the clearest caution flag. With MACD at 3.926, signal at 4.224, and a histogram of -0.297, the shorter momentum line is now below the signal line, which implies the latest push has lost some internal force even while price remains elevated. In practical terms, this is the kind of setup that can appear near resistance: price looks firm, but the underlying acceleration is softening. That is not a bearish collapse signal by itself; it is a warning that the stock may need either a pause or a fresh burst of volume to keep rising.
Momentum is strong, but not fully synchronized.
Volatility & Volume
Chevron’s Bollinger band width of 12.6% is normal, not compressed. That matters because a squeeze usually hints at an imminent expansion, while a normal band width suggests the market is already moving in a fairly orderly way. The stock’s %B of 80% places it near the upper band at 211.23, which is consistent with a strong tape but also with a market that is paying up near the top of the recent envelope. If price can press through that upper band, the move would signal expansion; if it stalls here, the band becomes a visible reference for exhaustion.
Volume is more supportive than the oscillators. The latest turnover of 12,048,900 shares was about 1.5× the 20-day average of 7,978,255, and OBV is rising. OBV, or on-balance volume, is a cumulative gauge that tracks whether volume is flowing into up days or out of them. A rising OBV alongside a price advance usually means the move is being validated by participation rather than driven by thin trading. In other words, the market is not just marking time; more investors are showing up on the buy side.
Still, the stock is now close to a zone where participation will need to remain firm.
Key Levels & Scenarios
The immediate technical battlefield is clear. Resistance at 206.14 has just been matched by the last price, while upper Bollinger resistance at 211.23 and the 3-month high at 208.98 frame the next overhead test. On the downside, SMA20 at 198.73 is the first important trend line, and 20-day support at 186.41 is the deeper level that would matter if the current advance loses traction. ATR at 3.69, or 1.8% of price, signals moderate daily movement, so a break of these levels would likely unfold in measured steps rather than a single dramatic gap.
If Chevron clears the current ceiling with volume still running above average, the chart would suggest a continuation attempt toward the upper band and then the recent high. If it fails to hold above the mid-198s area, the first message would be that the rally is cooling rather than reversing. If the 186.41 support gives way, the uptrend would be much harder to defend.
Technical Verdict: HOLD (wait & see)
HOLD (wait & see)
- Reason 1: Price trend is positive — Chevron remains above SMA20 at 198.73 and SMA50 at 188.19, with the SMA20 slope rising.
- Reason 2: Participation is supportive — volume is running at 1.5× the 20-day average and OBV is rising, which confirms demand.
- Reason 3: Momentum is mixed — Stochastic is overbought and MACD histogram is negative, so the trend is intact but not fully confirmed.
- Verdict invalidated if price falls below 186.41, because that would break the 20-day support that is currently anchoring the trend.
- Ideal Entry Range: 198.73 to 206.14
- Exit Target: 208.98 to 211.23
- Stop Loss protection: below 186.41
For non-traders: Chevron is still in an uptrend, but it is now close to resistance, so the chart says “trend intact, but the next move needs confirmation.”
Summary Data CVX
| Last price | 206.14 USD |
| Change 1 day / 5 days / 1 month | 2.12% / 1.50% / 6.71% |
| Trend / MA-cross | uptrend / none |
| SMA20 / SMA50 | 198.73 / 188.19 |
| RSI (14) / Stochastic %K | 65.7 / 81.4 |
| Bollinger %B / ATR | 80% / 3.69 |
| Support / Resistance 20 days | 186.41 / 206.14 |
| Data as of | 31 Agustus 2026 20:30 WIB |
Track CVX stock price daily: live levels, support/resistance and our full CVX analysis history.



