TSLA Stock Gains 5.51% Today, Testing Key Resistance
On September 1, 2026: price 367.95 USD, trend sideways, RSI 58.6, support 319.53, resistance 367.95. technical analysis of tsla stock. TSLA Stock Gains — full…
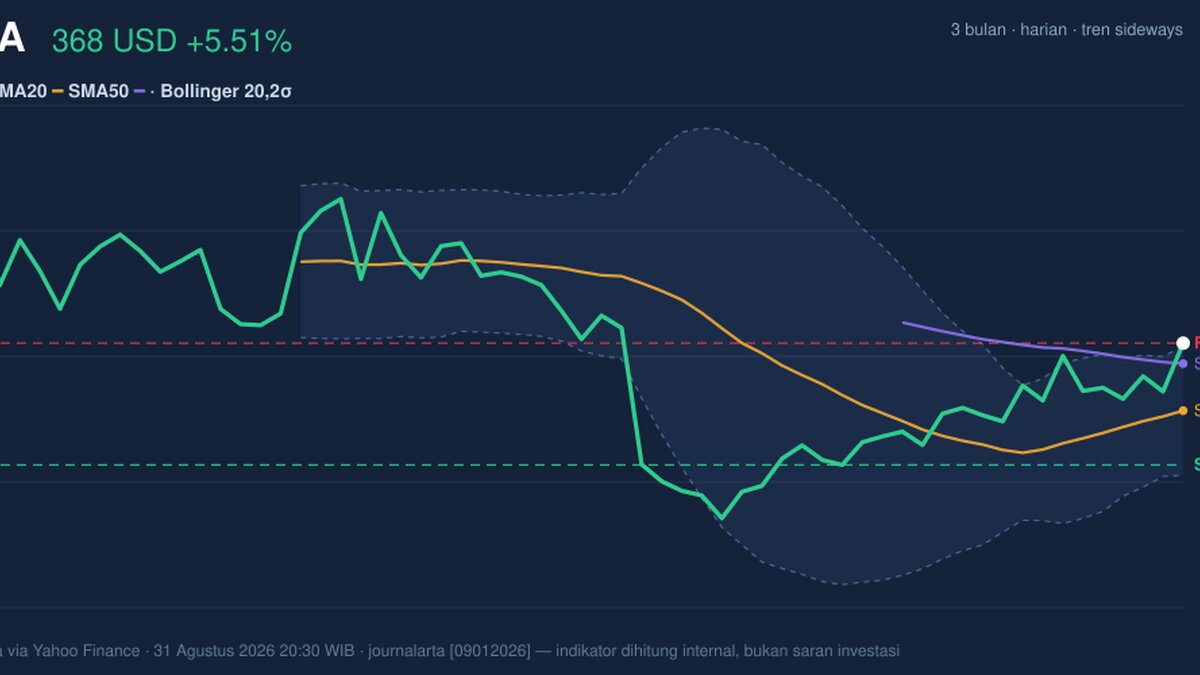
Tesla traded at 367.95 USD on NASDAQ after adding 5.51% in the latest session, extending a 14.24% one-month gain and pushing the stock to the top of its recent range. The move matters because it came with volume of 61,569,100, or about 1.8× the 20-hour average, which suggests the advance was backed by real participation rather than a thin, low-conviction bounce.
Trend & Price Action
The chart shows Tesla still in a sideways trend, even though the price is now trading above SMA20 at 341.11 and above SMA50 at 359.82. That positioning is important: the stock has recovered enough to reclaim both short- and medium-term averages, but the lack of a fresh MA-cross means the move is better read as an improvement in trend quality than a full regime change.
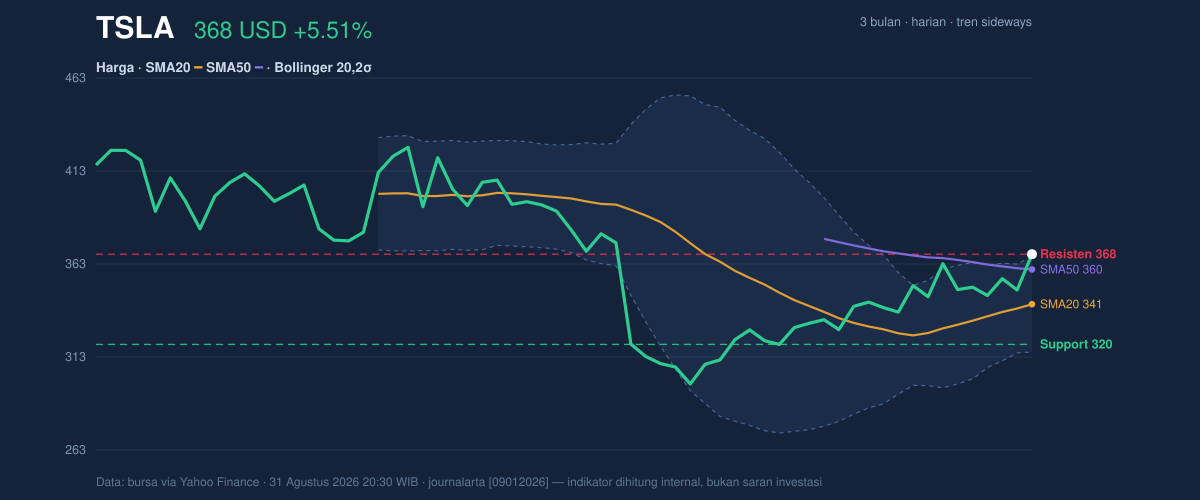
The slope of SMA20 at 3.33% over 5 days shows the short-term trend is rising, which often signals that buyers are still pressing their advantage. At the same time, Tesla is sitting at 100% of its 20-hour range, with 367.95 matching the stated resistance. That placement is a double-edged signal: it confirms strength, but it also means the stock is testing an area where momentum can stall if fresh buying does not continue.
The broader context is mixed but constructive. Tesla remains well below the 3-month high of 433.60, yet comfortably above the 3-month low of 297.38. In plain terms, the stock has repaired a meaningful part of its prior decline, but it has not yet broken into a new sustained uptrend.
Oscillators & Momentum
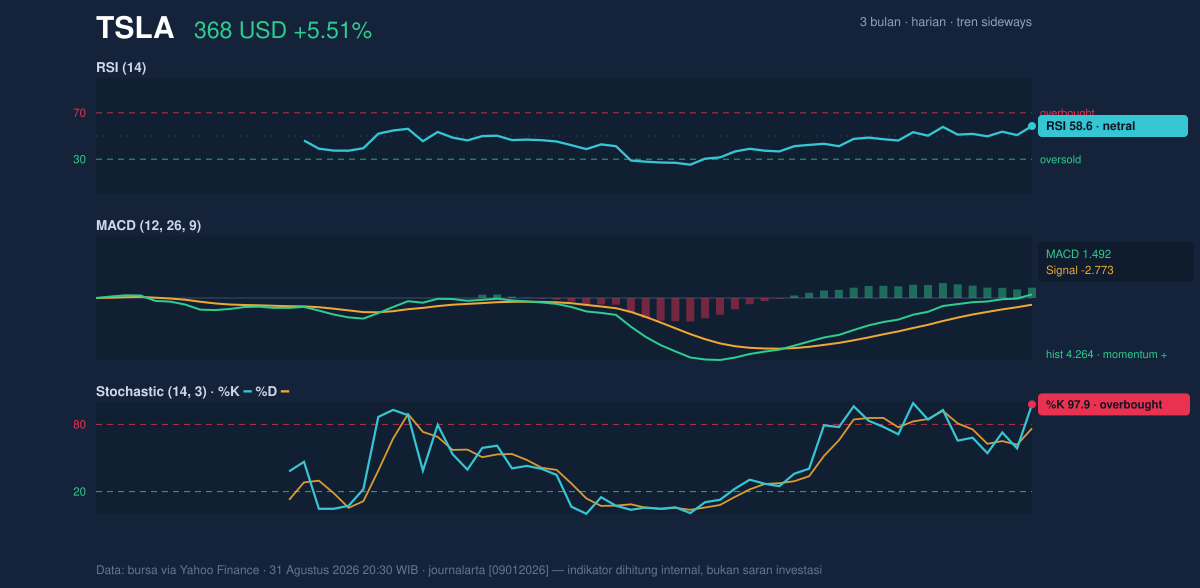
Momentum is stronger than the trend label alone would suggest. MACD at 1.492 is above its signal line at -2.773, with a histogram of 4.264, which indicates upside momentum is still expanding. For readers unfamiliar with MACD, this is a common way to gauge whether recent price movement is accelerating or fading; here, it says the rally still has internal force.
The warning comes from the oscillators. RSI at 58.6 is neutral, so the stock is not yet in a classic overbought condition by that measure. But Stochastic %K at 97.9 versus %D at 76.4 is firmly overbought, signaling price is closing near the top of its recent trading band. That does not automatically mean a reversal is imminent, but it does mean the stock is more vulnerable to pauses or pullbacks if buyers hesitate.
The combination is nuanced: MACD says the trend impulse is still positive, while Stochastic says the short-term move may be stretched. When those two line up imperfectly, it often points to a market that can keep rising, but with more stop-start action rather than a smooth climb.
Volatility & Volume
Tesla’s ATR(14) of 13.51, equal to 3.7% of price, signals elevated day-to-day movement. ATR, or average true range, is a measure of how much a stock typically moves; a higher reading means wider trading swings and a greater chance that price can quickly overshoot nearby levels.
Bollinger Bands add another layer. The upper band sits at 366.80, the middle band at 341.11, and the lower band at 315.42, with %B at 102%. A %B reading above 100% means the price is trading beyond the upper band, which often reflects strong momentum but also a market that may be stretched relative to its recent average. The 15.1% band width is described as normal, so this is not a squeeze setup; instead, it suggests Tesla is moving with enough volatility to keep directional follow-through possible.
Volume confirms the move. The latest print of 61,569,100 versus the 20-hour average of 34,343,680 shows broad participation, and OBV is rising. OBV, or on-balance volume, tracks whether volume is flowing into or out of a stock; a rising reading alongside rising price is generally a sign that buyers are accumulating shares rather than simply reacting to a headline.
Key Levels & Scenarios
The immediate map is tight and clear. 367.95 is both the latest price and the current resistance marker, so Tesla is effectively pressing the ceiling of its recent trading band. On the downside, 341.11 is the key short-term reference because it is the SMA20 and the Bollinger middle band, while 319.53 is the cited 20-hour support.
If Tesla holds above 341.11, the chart keeps its bullish structure intact and the market can continue to treat pullbacks as consolidation rather than breakdown. If price slips back below 341.11, the signal would be that the recent breakout attempt is losing traction. A fall through 319.53 would be more serious, because it would put the stock back into the lower part of its recent range and weaken the case that buyers remain in control.
Technical Verdict: HOLD (wait & see)
HOLD (wait & see)
- MACD is positive and the histogram remains strongly supportive, which argues the upside impulse is still alive.
- Volume is 1.8× average and OBV is rising, confirming that the move has participation behind it.
- Stochastic is overbought and price is trading above the Bollinger upper band at 366.80, which raises the odds of a pause or pullback near current levels.
Verdict invalidated if price falls below 341.11, because that would mean Tesla has lost both its SMA20 and the Bollinger midline.
- Ideal Entry Range: 341.11 to 319.53
- Exit Target: 366.80 to 367.95
- Stop Loss protection: below 315.42
In plain English, the chart still leans positive, but Tesla is stretched enough that the next move matters more than the last one.
The next scheduled reference point is Tesla’s continued trade around 367.95 against 366.80 resistance, with 341.11 as the first level traders will watch for confirmation.
Summary Data TSLA
| Last price | 367.95 USD |
| Change 1 day / 5 days / 1 month | 5.51% / 5.44% / 14.24% |
| Trend / MA-cross | sideways / none |
| SMA20 / SMA50 | 341.11 / 359.82 |
| RSI (14) / Stochastic %K | 58.6 / 97.9 |
| Bollinger %B / ATR | 102% / 13.51 |
| Support / Resistance 20 days | 319.53 / 367.95 |
| Data as of | 31 Agustus 2026 20:30 WIB |
Track TSLA stock price daily: live levels, support/resistance and our full TSLA analysis history.



