UOB Stock Analysis: Gains 2.26%, Death Cross Pressure
On September 1, 2026: price 41.56 SGD, trend downtrend, RSI 40.9, support 40.22, resistance 43.58. technical analysis of uob stock. UOB Stock Analysis — full…
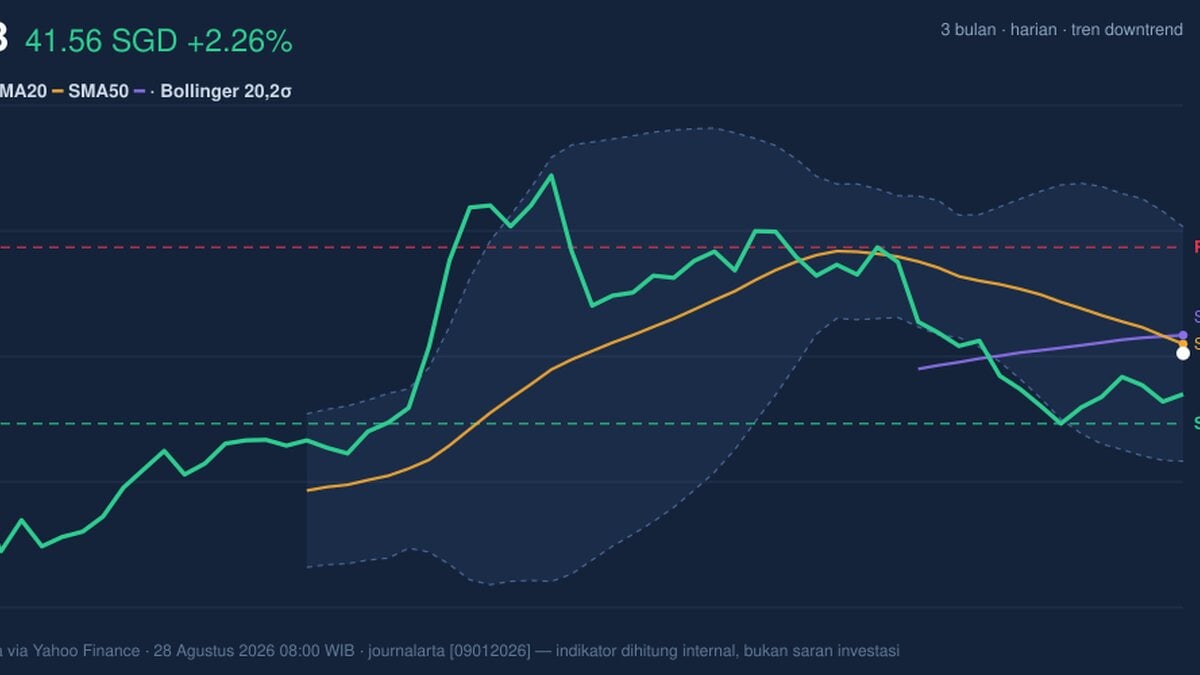
United Overseas Bank’s U11.SI shares rose to SGD 41.56 on the Singapore Exchange on 28 August 2026, recovering 2.26% from the previous close of 40.64, but the move sits inside a broader pattern that still points lower. The stock is trading below its SMA20 at 41.74 and below its SMA50 at 41.90, while the chart shows a death cross — the shorter average has slipped under the longer one, a classic sign that recent weakness is outweighing the earlier trend. In plain terms, UOB has bounced, but the market has not yet proved that the bounce is more than a pause in a downtrend.
Trend & Price Action
As shown in the chart, UOB is still positioned in the lower half of its recent range, with the last price sitting around 40% of the 20-day range. That matters because stocks that spend time near the bottom of their range usually need stronger buying pressure to break the pattern; otherwise, rallies tend to fade as they approach moving-average resistance. The broader trend remains downtrend, and the SMA20 slope of -1.59% over 5 days shows that the short-term trend is still leaning downward rather than flattening out.
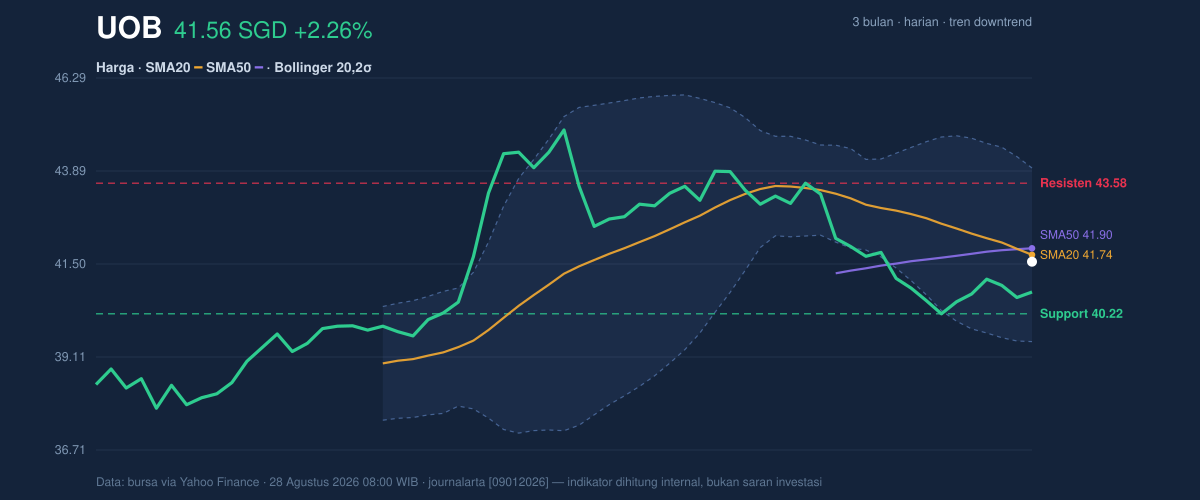
The Bollinger setup adds to that message. Price is near the middle band at 41.74, with the upper band at 43.97 and the lower band at 39.50. A middle-band position is not bearish by itself, but in a downtrend it often signals a market trying to stabilize rather than one already in a fresh advance. The 10.7% band width is normal, so there is no volatility squeeze suggesting an imminent breakout; instead, the stock looks contained, with room to move but no strong compression signal forcing a sharp directional change.
Oscillators & Momentum
The momentum indicators are mixed, which is important because mixed momentum often explains why a stock can rise on the day but still fail to turn a trend. The RSI at 40.9 is neutral but leaning weak, meaning the stock is not oversold enough to imply a strong rebound signal, yet it is also not stretched into overbought territory. The Stochastic %K at 29.3 and %D at 27.1 sit near the lower end of the scale, which suggests price is closer to a potential short-term turn than to a fully extended selloff, but the indicator has not crossed decisively into a bullish reversal zone.
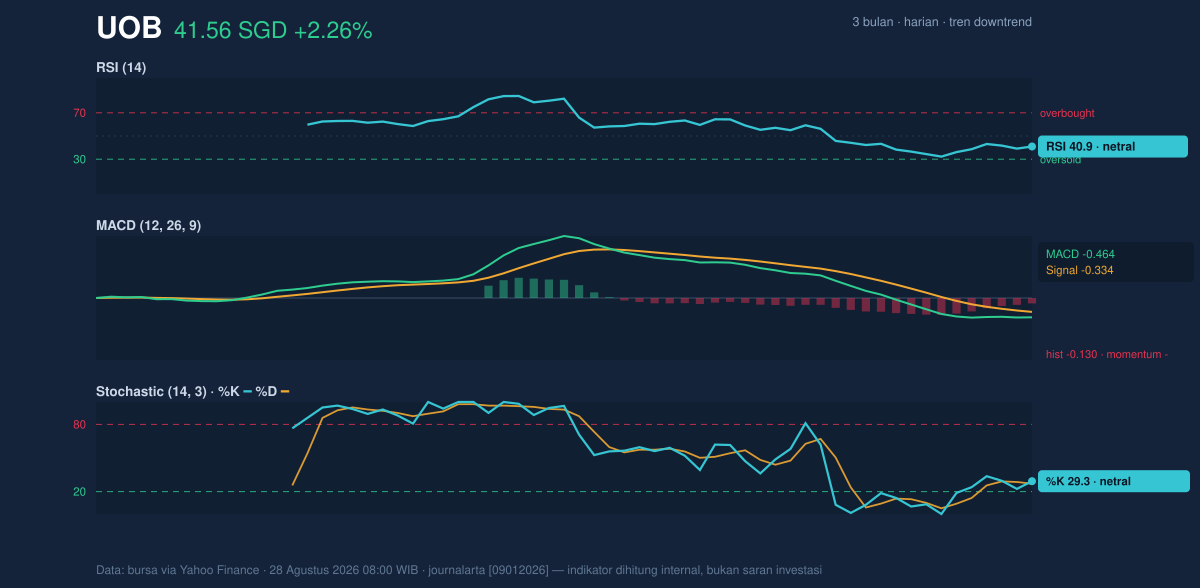
The clearest message comes from MACD. With MACD at -0.464, signal at -0.334, and histogram at -0.130, momentum remains negative because the MACD line is still below the signal line. That negative histogram tells readers the downside force is still present, even if it is not accelerating sharply. In practical terms, the stock is trying to recover, but momentum has not yet confirmed that recovery.
Volatility & Volume
Volatility is subdued. The ATR(14) at 0.58, equal to 1.4% of price, indicates relatively low daily movement. That usually means traders are not pricing in a large immediate swing, and it also suggests that any breakout attempt may need stronger participation to stick. The volume picture supports that caution. Last volume was 1,717,900, only about 0.5x the 20-day average of 3,596,950, so the latest bounce came on quiet trading rather than broad conviction. The OBV is down, which matters because on-balance volume tracks whether money flow is generally accumulating or leaving; a falling OBV says the market has not yet shown durable buying interest behind the price recovery.
In other words, the day’s gain is real, but it does not yet look like a high-conviction reversal. A stronger move would usually come with expanding volume and a firming OBV, not with thin participation.
Key Levels & Scenarios
The nearest support is 40.22, while resistance is 43.58. Those levels define the current battleground. If price stays above support, the stock can continue to base and test whether the recent bounce has staying power. If it fails to hold that area, the chart leaves room to revisit the lower Bollinger band at 39.50, which becomes the next technical reference if selling pressure returns. On the upside, a move through resistance would matter because it would place the stock above the recent ceiling and closer to the upper Bollinger band at 43.97, where rallies often meet profit-taking.
The 3-month range also frames the story: 45.15 marks the high and 37.52 the low. UOB is trading below the midpoint of that range, which is consistent with a market still repairing rather than one already fully recovered. That positioning does not rule out a rebound, but it does mean the stock needs to prove itself above nearby resistance before the trend picture changes.
Technical Verdict: HOLD (wait & see)
HOLD (wait & see)
- Reason 1: The trend remains weak, with price below SMA20 and SMA50 and a death cross still in place.
- Reason 2: MACD is negative, showing momentum has not yet turned bullish even after the latest rebound.
- Reason 3: Volume is 0.5x the 20-day average and OBV is down, so the bounce lacks confirmation.
- Verdict invalidated if price breaks above 43.58, which would challenge the current resistance structure and weaken the bearish setup.
- Ideal Entry Range: 40.22 to 41.74
- Exit Target: 43.58 to 43.97
- Stop Loss protection: below 39.50
For non-traders, this means UOB has bounced, but the chart still needs stronger proof before the move can be trusted as a lasting reversal.
The next technical test is whether the shares can hold 40.22 and then challenge 43.58 without volume staying at 0.5x of average.
Summary Data UOB
| Last price | 41.56 SGD |
| Change 1 day / 5 days / 1 month | 2.26% / 2.54% / -5.29% |
| Trend / MA-cross | downtrend / death |
| SMA20 / SMA50 | 41.74 / 41.90 |
| RSI (14) / Stochastic %K | 40.9 / 29.3 |
| Bollinger %B / ATR | 46% / 0.58 |
| Support / Resistance 20 days | 40.22 / 43.58 |
| Data as of | 28 Agustus 2026 08:00 WIB |
Track UOB share price daily: live levels, support/resistance and our full UOB analysis history.