WMT Stock Gains 1.73%, Momentum Weakens In Focus
On September 1, 2026: price 104.87 USD, trend downtrend, RSI 39.1, support 102.63, resistance 116.01. technical analysis of wmt stock. WMT Stock Gains — full…
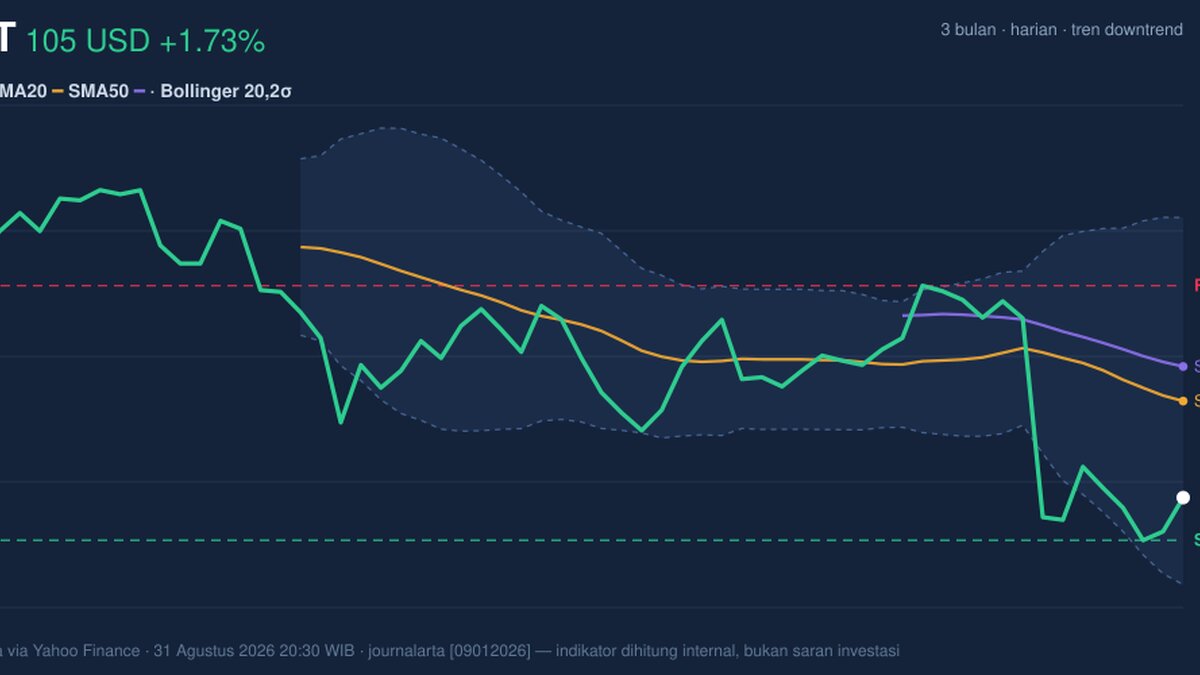
Walmart is holding above a key short-term floor, but the tape still says sellers have the upper hand for now. The shares rose to 104.87 USD on NYSE trading, up from the prior close of 103.09, yet the move came inside a broader slide that has left the stock below its main moving averages and near the lower end of its recent range.
Trend & Price Action
As shown in the chart, WMT remains in a downtrend, with the SMA20 at 109.94 and the SMA50 at 111.76 both sitting above the current price. That matters because moving averages are not just lines on a chart; they are a rough read on where the market has been willing to do business recently. When price stays below both, rallies tend to be treated as recovery attempts rather than proof of a trend change.
The slope of the SMA20 is -1.79% over 5 days, which signals that the short-term trend is still leaning lower rather than flattening out. There is no fresh MA-cross, so the chart has not yet produced the kind of crossover that would suggest a more durable shift in momentum. Price is also sitting at only 17% of the 20-hour range, close to the lower end of the recent band, which shows the stock is still trading nearer support than resistance.
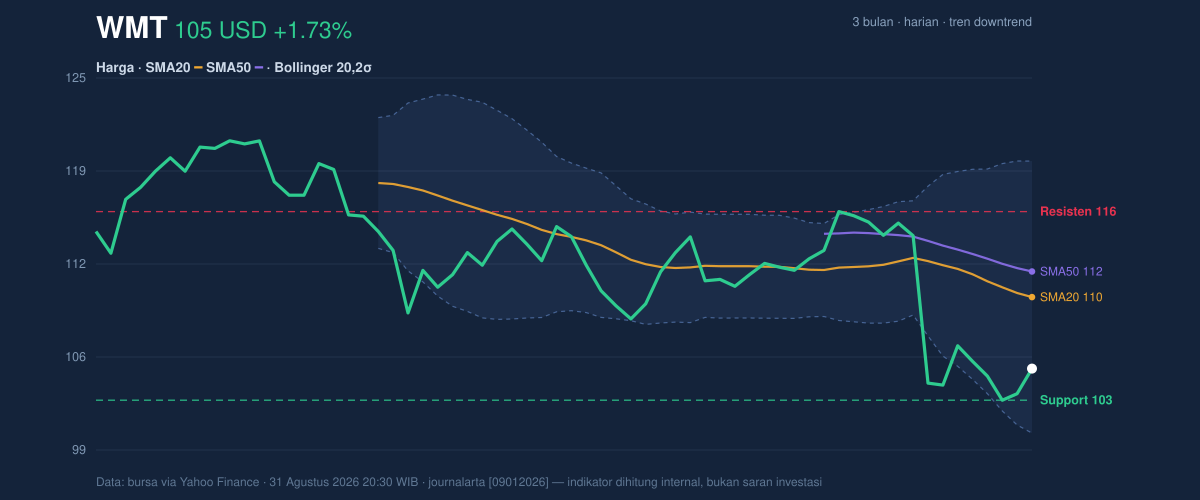
The nearest support is 102.63, with a broader 3-month low of 102.15 just beneath it. That zone now acts as the market’s line in the sand: if it holds, the stock can continue to build a base; if it breaks, the chart risks opening into a weaker leg. On the upside, 116.01 is the first resistance to watch, and then the 3-month high of 122.94 becomes the larger cap on any rebound.
Oscillators & Momentum
Momentum is mixed, and that is the most important signal in the current setup. The RSI at 39.1 is still technically neutral, but it is drifting close to the lower half of its usual range, which tells readers that the stock has lost some internal strength without yet reaching a deep oversold extreme. In plain language: the market is tired, but not exhausted.
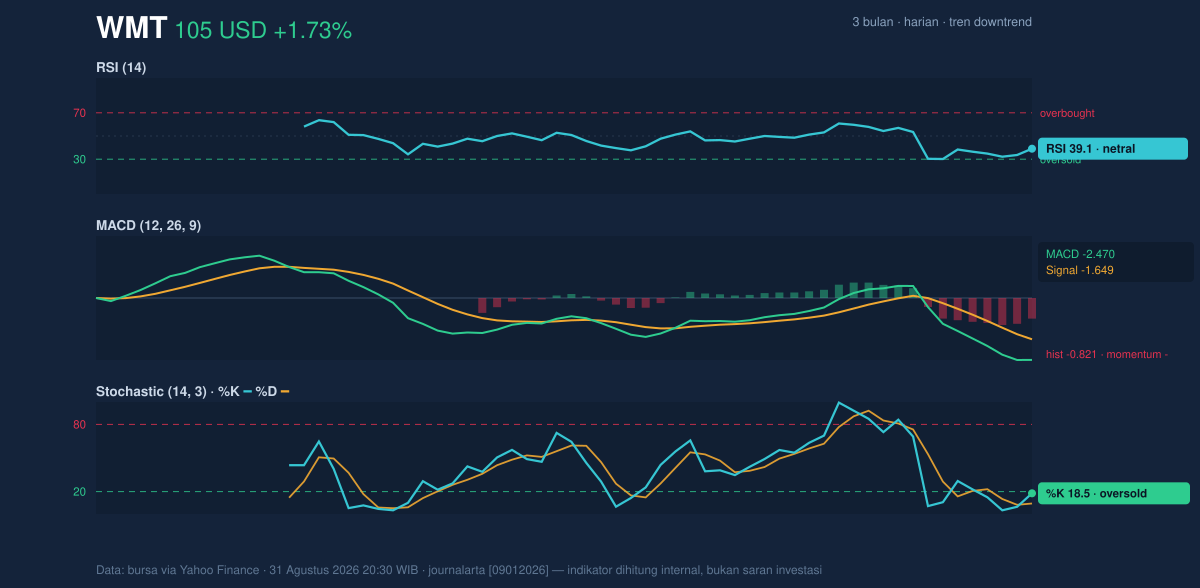
The Stochastic %K at 18.5 and %D at 9.4 are both in oversold territory, which often means downside pressure has become stretched in the short run. That does not guarantee a bounce, but it does suggest the recent selling may be running ahead of itself. By contrast, the MACD at -2.470, with the signal line at -1.649 and the histogram at -0.821, still points to negative momentum. In other words, the trend-following indicator has not yet turned, so the oversold oscillators are trying to catch a rebound while the broader momentum engine still runs weak.
That split matters. When Stochastic is oversold but MACD remains negative, traders often see a market that can bounce, but may struggle to convert that bounce into a sustained trend unless price also reclaims the moving averages.
Volatility & Volume
The Bollinger Bands frame the stock’s current tension well. The upper band sits at 119.60, the middle band at 109.94, and the lower band at 100.29. With %B at 24%, price is trading in the lower quarter of the band structure, which usually signals that the stock is under pressure and closer to the downside boundary than the upside ceiling. The 17.6% band width is described as normal, so this is not a compressed setup waiting for a dramatic squeeze; it is a fairly ordinary volatility regime with room for movement, but no obvious spring-loaded pattern.
The ATR at 2.79, or 2.7% of price, confirms moderate volatility. That means daily swings are present but not extreme, which can help explain why the stock can drift lower without looking disorderly. Volume came in at 34,168,400, about 1.2x normal, but OBV is falling. That combination is important: heavier trading alone is not bullish if the on-balance volume, which tracks whether volume is supporting price gains or losses, keeps trending down. It suggests distribution is still outweighing accumulation.
Key Levels & Scenarios
The immediate battle is between 102.63 support and 116.01 resistance. A firm hold above support would keep the stock inside its current range and leave room for a technical rebound toward the middle Bollinger band at 109.94, then the upper side of the recent range. If price can reclaim the 109.94 SMA20, that would be an early sign that sellers are losing control. If the stock fails to hold 102.63, the chart would likely shift into a weaker posture, with the 102.15 3-month low becoming the next reference point.
The key point is that the stock is not in a clean reversal, but it is also not in free fall. It is sitting in the area where technical damage can either stabilize or deepen, depending on whether buyers defend the floor.
Technical Verdict: HOLD (wait & see)
HOLD (wait & see)
- MACD remains negative, so trend momentum has not yet turned in favor of a sustained recovery.
- Price is below both SMA20 and SMA50, which keeps the chart in a short-term downtrend.
- Stochastic is oversold, which supports a bounce attempt, but not yet a confirmed reversal.
Verdict invalidated if price breaks below 102.63, because that would put the stock at risk of testing the 102.15 three-month low and weaken the current base case.
- Ideal Entry Range: 102.63 to 104.87
- Exit Target: 109.94, then 116.01
- Stop Loss protection: below 102.15
In plain English: the stock looks stretched enough for a rebound, but not strong enough yet to call a trend change.
Summary Data WMT
| Last price | 104.87 USD |
| Change 1 day / 5 days / 1 month | 1.73% / -1.52% / -5.28% |
| Trend / MA-cross | downtrend / none |
| SMA20 / SMA50 | 109.94 / 111.76 |
| RSI (14) / Stochastic %K | 39.1 / 18.5 |
| Bollinger %B / ATR | 24% / 2.79 |
| Support / Resistance 20 days | 102.63 / 116.01 |
| Data as of | 31 Agustus 2026 20:30 WIB |
Track WMT stock price daily: live levels, support/resistance and our full WMT analysis history.