XOM Stock Gains 2.88% Today, Momentum Weakens
On September 1, 2026: price 160.95 USD, trend uptrend, RSI 55.8, support 151.63, resistance 166.15. technical analysis of xom stock. XOM Stock Gains — full…
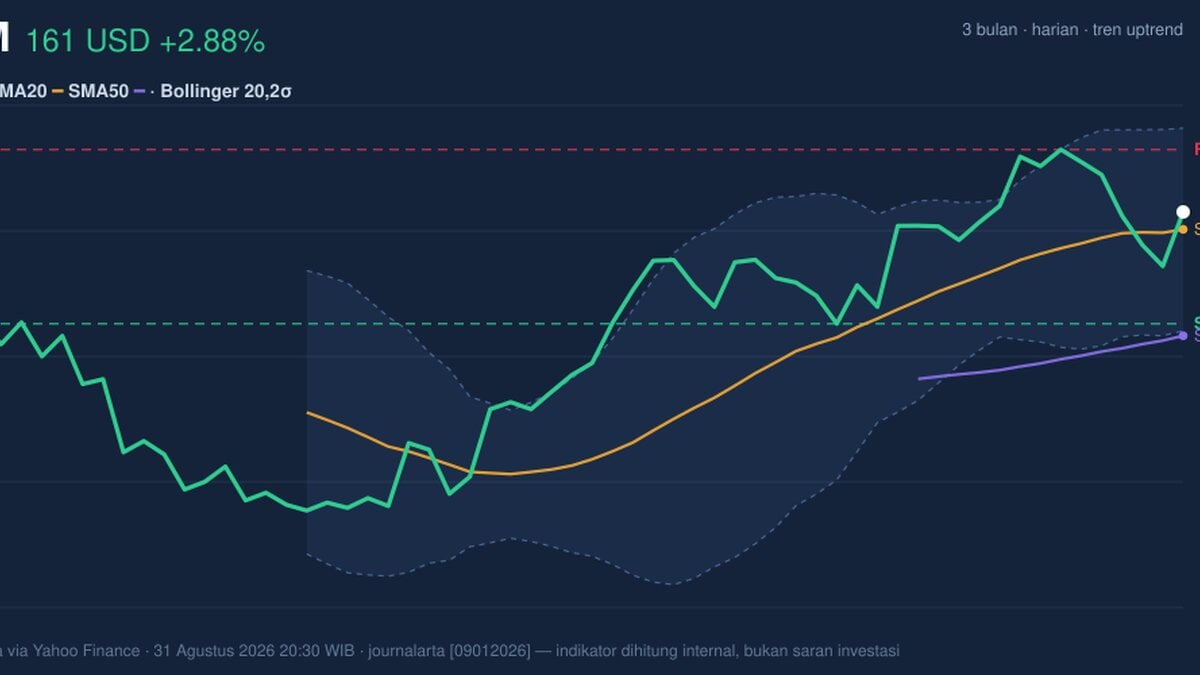
ExxonMobil rose to 160.95 USD on the NYSE on 31 August 2026, after a 2.88% one-day gain, but the move sits inside a broader pattern that is still trying to prove itself. The shares are above the short-term trend line and the 20-day average, yet the latest momentum reading is not fully confirming the advance, which means the market is still rewarding the stock without fully committing to a stronger breakout.
Trend & Price Action
The first signal in the chart is constructive: ExxonMobil is trading above SMA20 at 159.50 and well above SMA50 at 150.63, with the 20-day average still rising at 0.74% over 5 days. That combination usually tells traders the stock is in an established uptrend rather than a short-lived bounce, because the shorter average is leading the longer one and price is holding on the right side of both.
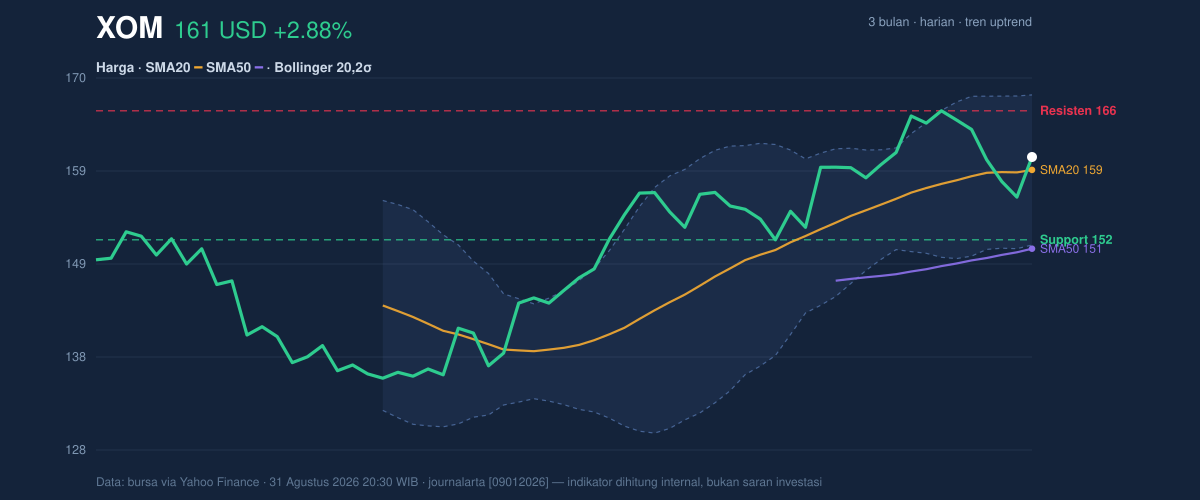
The more cautious detail is that there is no fresh MA-cross, so the market is not getting a new trend signal from the moving averages, only confirmation of an existing one. Price is also sitting at about 64% of the 20-hour range, between support at 151.63 and resistance at 166.15, which places it in the upper half of the recent band but not yet at the ceiling. In plain terms, the stock has room to rise, but it is close enough to nearby resistance that buyers still need to show follow-through.
The broader three-month frame sharpens that picture. The stock’s 3-month high is 168.64 and the 3-month low is 134.95, so the current price is much nearer the upper boundary of that range than the lower one. That usually signals that the market has already done a fair amount of work rebuilding confidence, but it also means the next push matters more: if the move stalls near resistance, the chart can quickly shift from “healthy trend” to “range-bound pause.”
Oscillators & Momentum
Momentum is where the story becomes less one-sided. The RSI at 55.8 is neutral, which means the stock is neither stretched nor washed out; it is simply trading with moderate strength. The Stochastic %K at 38.5 and %D at 30.5 are also neutral, but they sit low enough to suggest the stock is not overextended after the recent rise. For general readers, that combination usually means the market has not yet reached the kind of overheated condition that often precedes a pullback.
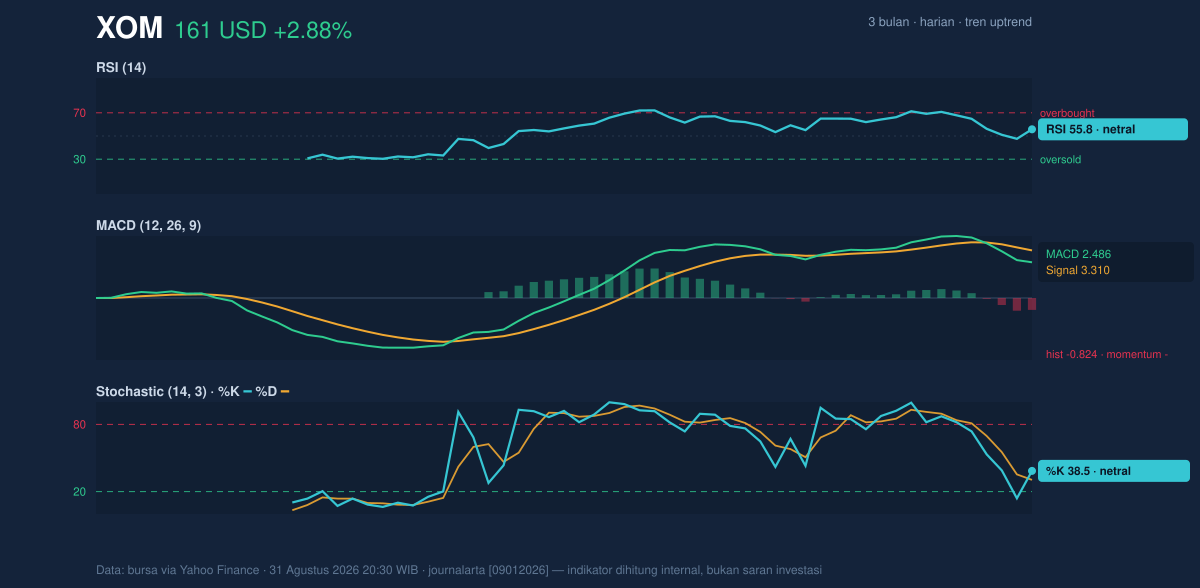
The caution comes from MACD, which is still negative in the short term. MACD at 2.486 is below the signal line at 3.310, and the histogram at -0.824 shows momentum is currently lagging price. That matters because price can rise while momentum weakens; when that happens, the chart is telling you the move is not yet fully endorsed by the faster trend gauges. In this case, the stock is advancing, but the internal pace of that advance looks softer than the headline gain.
Volatility & Volume
Volatility is contained rather than explosive. The ATR at 3.26, or 2.0% of price, points to moderate daily movement, while the Bollinger Bands show a 10.6% width, described as normal. That means the stock is not in a squeeze that often precedes a sharp breakout, nor is it in a wide, disorderly expansion that would suggest panic or euphoria. The %B at 59% also places price slightly above the middle of the band, which is consistent with a stock leaning upward without being overbought.
Volume, however, sends a mixed message. The latest session traded 18,363,400 shares, or about 1.3 times the 20-day average of 14,418,865. That is enough to say the move had participation, which is important because price advances on thin volume can be fragile. But OBV is down, and that divergence suggests that cumulative buying pressure has not fully turned in the stock’s favor. Put simply, the market traded actively on the day, but the longer-running volume flow still looks hesitant.
Key Levels & Scenarios
The chart’s nearest technical map is clear: support at 151.63 and resistance at 166.15. If price can push through resistance and stay above it, the next reference becomes the 3-month high at 168.64, which is the obvious test of whether this uptrend is ready to extend. If the stock fails near resistance and slips back toward the mid-band around 159.50, the market would be signaling that the current move is still more of a consolidation inside an uptrend than a fresh leg higher.
For now, the chart says the trend is intact, but confirmation is incomplete. Price is above the moving averages, yet MACD and OBV are not fully aligned, so the stock looks constructive rather than decisive. The key question is whether ExxonMobil can convert its position above SMA20 into a clean move through 166.15, because that would improve the quality of the trend signal instead of just extending the current drift upward.
Technical Verdict: HOLD (wait & see)
HOLD (wait & see)
- Reason 1: Price is above SMA20 at 159.50 and SMA50 at 150.63, which keeps the broader trend positive.
- Reason 2: RSI at 55.8 and Stochastic %K/%D at 38.5/30.5 are neutral, so the stock is not overbought and still has room to move.
- Reason 3: MACD histogram at -0.824 and OBV down show momentum and volume are not fully confirming the price gain.
- Verdict invalidated if price falls below 151.63, which would break the nearest support and weaken the current trend structure.
- Ideal Entry Range: 159.50 to 151.63, with the cleaner technical zone nearer the SMA20 at 159.50 if price holds there
- Exit Target: 166.15, then the 3-month high at 168.64 if resistance gives way
- Stop Loss protection: below 151.63, with deeper technical damage if the stock cannot defend that support
For non-traders, this means ExxonMobil is still trending better than it was earlier, but the chart is waiting for stronger proof before calling the move fully convincing.
The next technical checkpoint is whether the stock can hold above 159.50 and challenge 166.15 in the next session.
Summary Data XOM
| Last price | 160.95 USD |
| Change 1 day / 5 days / 1 month | 2.88% / -2.52% / 3.54% |
| Trend / MA-cross | uptrend / none |
| SMA20 / SMA50 | 159.50 / 150.63 |
| RSI (14) / Stochastic %K | 55.8 / 38.5 |
| Bollinger %B / ATR | 59% / 3.26 |
| Support / Resistance 20 days | 151.63 / 166.15 |
| Data as of | 31 Agustus 2026 20:30 WIB |
Track XOM stock price daily: live levels, support/resistance and our full XOM analysis history.



