AIA Death Cross Pressure: Stock Gains 0.60% (September 2, 2026)
On September 2, 2026: price 75.95 HKD, trend sideways, RSI 55.9, support 70.40, resistance 78.05. technical analysis of aia stock. AIA Death Cross Pressure —…
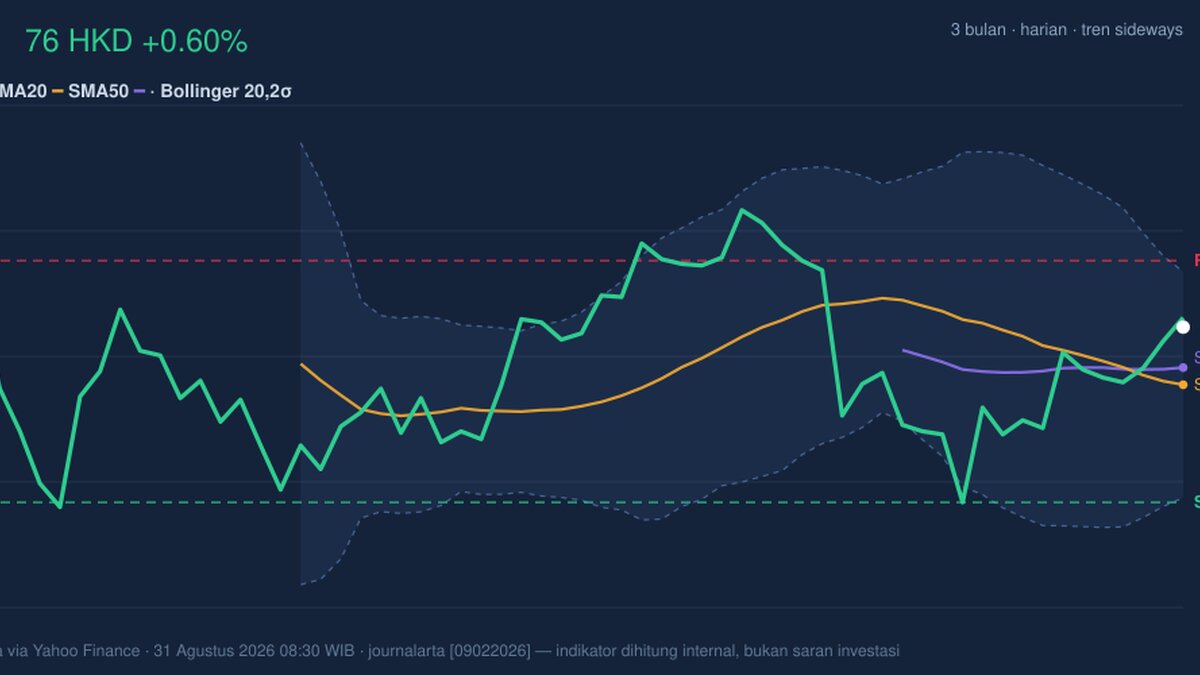
AIA Group’s shares ended at 75.95 HKD, up 0.60% on the day, but the move sits inside a broader pattern that is still best described as sideways, not decisively trending. The stock is trading above its SMA20 at 74.12 and just above its SMA50 at 74.67, which tells investors the recent bounce has recovered the short-term average zone. But the chart also shows a death cross, where the 20-day average has slipped below the 50-day average, a classic signal that the medium-term trend has weakened even if price is temporarily firm. As shown in the chart, AIA is now near the upper part of its recent range, at about 73% of the 20-day band, leaving less room before overhead supply starts to matter.
Trend & Price Action
The key message from the price structure is mixed. AIA is above SMA20 and SMA50, which usually supports short-term stability, but the death cross means the longer rhythm of the share price is still under pressure. That matters because moving-average crossovers are less about the day itself and more about whether a rebound has enough depth to reverse a fading trend. Here, the answer is not yet convincing. The 1-month decline of 3.31% also shows that the recent lift has not fully repaired the earlier weakness.
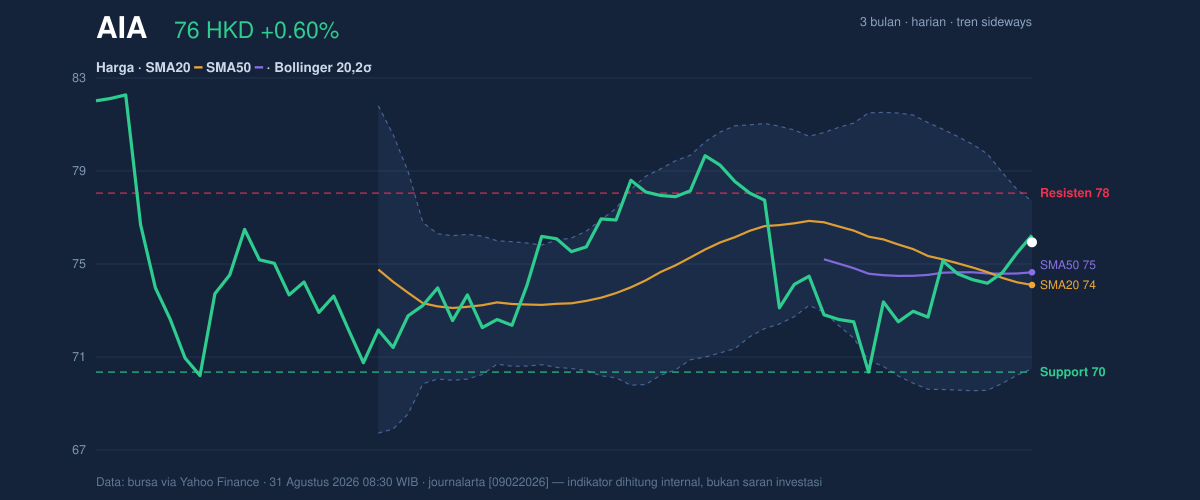
The broader range gives the context. The stock’s 3-month high of 82.85 and 3-month low of 69.05 frame a market that has already pulled back from the top of its range, then stabilized. That is consistent with a sideways phase, where rallies tend to meet selling before a new trend can establish itself. The nearest visible ceiling is the 20-hour resistance at 78.05, while the floor is the 20-hour support at 70.40. Price is closer to resistance than support, which is constructive in the short run but also means the stock is not cheap relative to its recent band.
Oscillators & Momentum
The momentum picture is stronger than the trend picture, but not clean. The RSI at 55.9 is neutral, which signals neither exhaustion nor deep weakness. That is important because RSI near the middle often means the market is still deciding whether the latest move is a real shift or just a pause. By contrast, the Stochastic reading of 99.2 / 88.7 is clearly overbought, meaning the share price has risen fast enough that near-term buyers may already be crowded in. In plain language, the stock can still rise from here, but the oscillator says it is no longer an easy entry point on momentum alone.
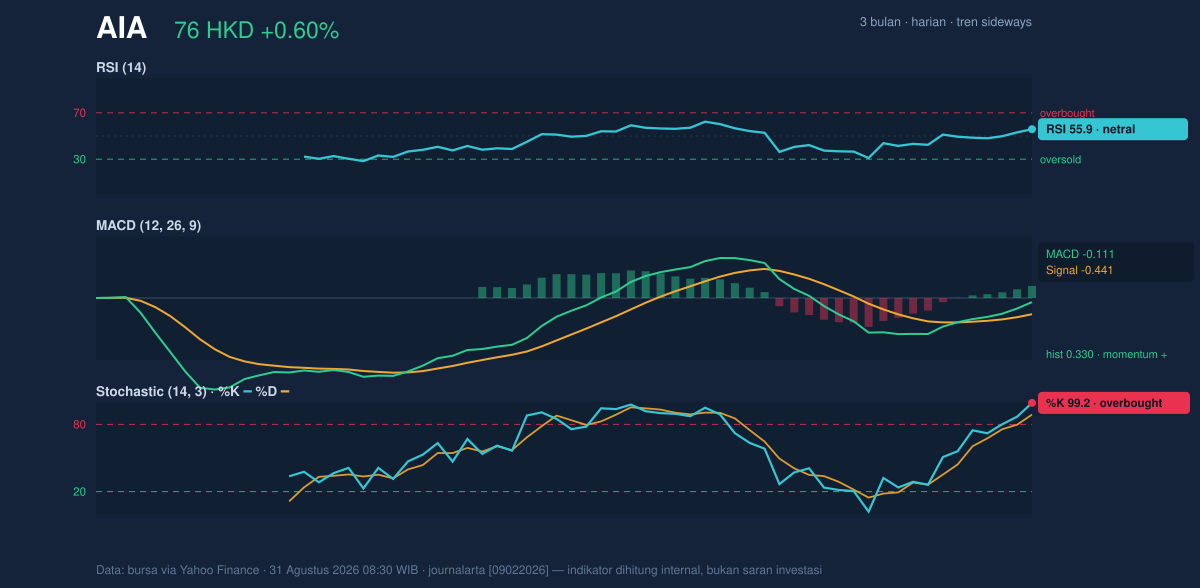
The MACD at -0.111 with a signal line at -0.441 and a positive histogram of 0.330 is the most encouraging technical element in the set. MACD is a trend-following indicator, and a positive histogram means short-term momentum is improving relative to its recent baseline. However, because the main MACD line is still below zero, the recovery has not fully escaped the earlier downshift. That creates a subtle but important split: momentum is improving, yet the larger trend has not fully turned.
Volatility & Volume
Volatility is neither compressed enough to hint at an imminent breakout nor elevated enough to suggest panic. The Bollinger band width of 9.7% is described as normal, which usually means the market is moving in a measured way rather than preparing for a sharp expansion. Price sits at a %B of 76%, so it is in the upper portion of the band but not pressing the top edge at 77.70. That positioning often signals strength, but it also leaves the stock vulnerable to stalling if momentum fades before resistance is cleared.
The ATR of 1.94, equal to 2.6% of price, points to moderate daily movement. In practical terms, that means the stock can travel enough to test nearby levels without needing a major catalyst. Volume does not yet confirm a strong conviction move. Last volume of 33,566,245 was essentially in line with the 20-day average of 33,756,060, or 1.0× normal. That tells readers the day’s rise was not driven by unusually heavy participation. The more cautionary signal is that OBV is falling, which implies that volume-backed accumulation has not kept pace with price stability. When price rises but OBV falls, the rally is often less durable than it first appears.
Key Levels & Scenarios
The first test is whether AIA can hold above 74.12, the SMA20 and middle Bollinger line. Holding above that area would keep the short-term structure intact. A failure there would shift attention back toward 70.55, the lower Bollinger band, and then 70.40 support. On the upside, the immediate barrier is 77.70 from the upper band, then 78.05 resistance. A move through that zone would matter because it would show the stock can absorb supply near the top of the recent range instead of just drifting into it.
The chart therefore suggests a market that is improving, but still needs confirmation. Price above the moving averages is a positive short-term sign, while the death cross and falling OBV keep the bigger picture cautious. The most useful read is that AIA is in a recovery attempt inside a still-fragile structure.
Technical Verdict: HOLD (wait & see)
HOLD (wait & see)
- MACD histogram is positive, showing improving momentum, but the main MACD line remains below zero.
- Stochastic is overbought at 99.2 / 88.7, which warns that the recent rise may be stretched near resistance.
- Death cross remains in place, so the medium-term trend has not fully repaired despite price being above SMA20 and SMA50.
Verdict invalidated if price falls below 70.40.
- Entry Range: 74.12 to 74.67
- Exit Target: 77.70 to 78.05
- Stop Loss: below 70.40
In plain English, the chart says AIA has improved, but it has not yet proven that the recovery is strong enough to outrun the older downtrend.
Summary Data AIA
| Last price | 75.95 HKD |
| Change 1 day / 5 days / 1 month | 0.60% / 1.81% / -3.31% |
| Trend / MA-cross | sideways / death |
| SMA20 / SMA50 | 74.12 / 74.67 |
| RSI (14) / Stochastic %K | 55.9 / 99.2 |
| Bollinger %B / ATR | 76% / 1.94 |
| Support / Resistance 20 days | 70.40 / 78.05 |
| Data as of | 31 Agustus 2026 08:30 WIB |
Track AIA share price daily: live levels, support/resistance and our full AIA analysis history.



