AstraZeneca Stock Drops 0.07% Today, Momentum Gains
On September 2, 2026: price 11,962.00 GBp, trend sideways, RSI 44.7, support 11,460.00, resistance 12,476.00. technical analysis of astrazeneca stock.
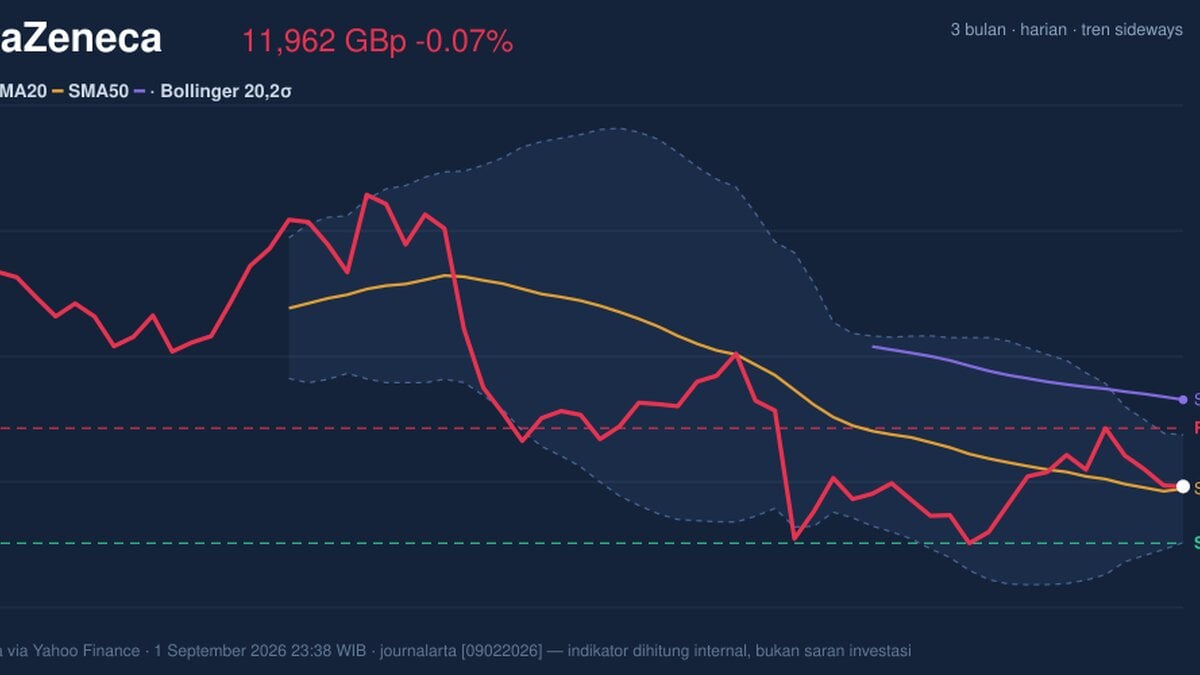
AstraZeneca’s shares on the LSE were little changed in the latest session, with AZN.L last at 11,962.00 GBp, down 0.07% on the day, while the broader short-term picture remains more complicated than that flat close suggests. The stock is trading above its 20-day average but still well below its 50-day average, a combination that usually signals a market trying to stabilise without yet proving a full trend reversal. As shown in the chart, that leaves AstraZeneca in a sideways range, with the latest move sitting near the middle of the recent band rather than at an extreme.
Trend & Price Action
The key message from the price structure is balance, not conviction. AstraZeneca’s price is above SMA20 at 11,941.80, which tells traders the very short-term tone has improved enough to keep the stock from slipping back into immediate weakness. But the SMA50 at 12,727.24 remains above the current price, which matters because longer trend followers still see the shares as below their medium-term average.
That gap between the two moving averages helps explain why the stock is described as sideways rather than trending cleanly higher. There is no fresh MA cross, so the chart does not yet show the kind of moving-average alignment that would confirm a sustained directional shift. The stock’s position at roughly 49% of the 20-hour range also reinforces the idea of equilibrium: it is not pressing resistance, but neither is it breaking down.
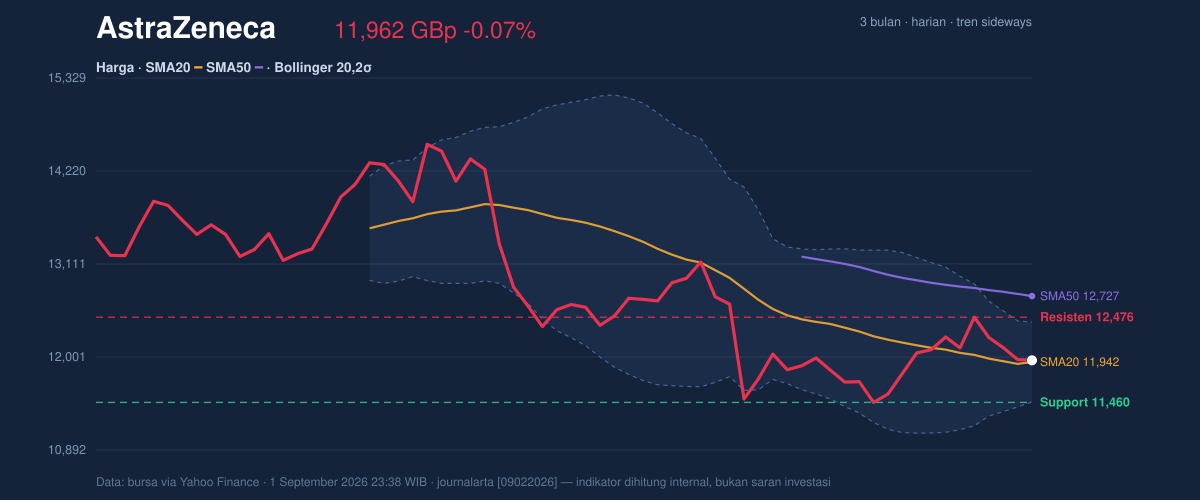
The Bollinger Bands add another layer. The upper band sits at 12,417.70, the lower band at 11,465.90, and the band width has narrowed to 8.0%. In plain terms, that squeeze means volatility has contracted, and markets often interpret that as a build-up of pressure before a larger move. The signal is not directional by itself, but it does warn that the current calm may not last.
Oscillators & Momentum
Momentum is where the story becomes more mixed. The RSI at 44.7 is neutral, which means the stock is neither stretched nor oversold. That is important because it suggests the recent softness has not yet become technically exhausted. In other words, there is room for further movement in either direction.
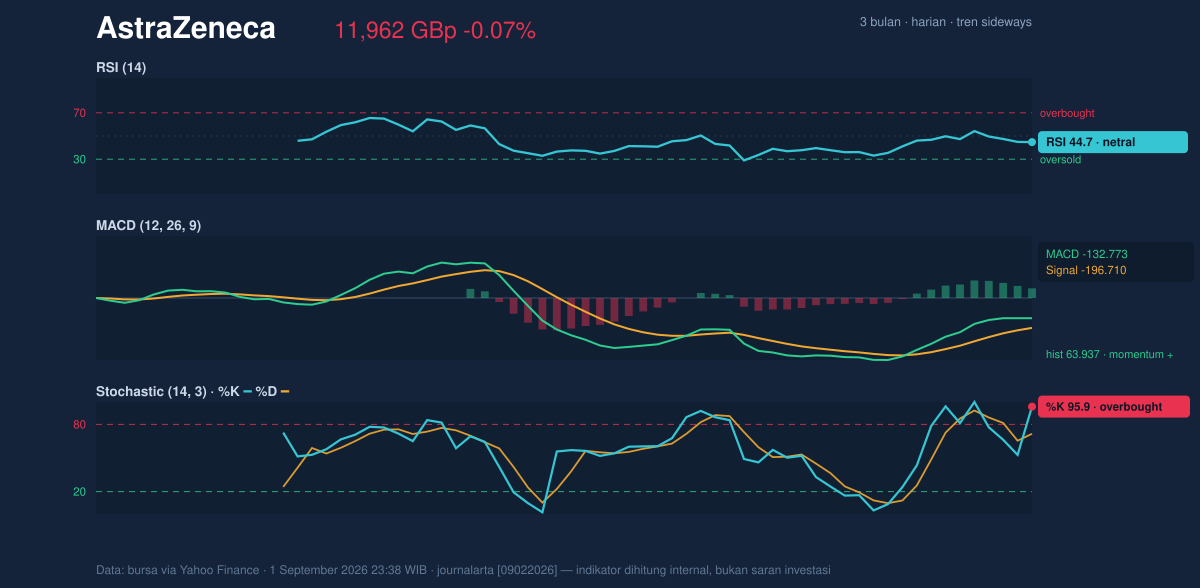
By contrast, the Stochastic reading of 95.9 / 71.6 is clearly overbought. That tells readers the latest push has been strong enough to leave the stock vulnerable to short-term cooling, even if the broader trend has not broken. When Stochastic is elevated while RSI remains neutral, it often means momentum is strong in the very short run, but not yet confirmed by the wider trend.
The MACD setup is more constructive. MACD at -132.773 is still below zero, so the stock has not fully escaped its weaker medium-term momentum. But the signal line at -196.710 sits lower still, and the histogram at 63.937 is positive. That combination means the MACD line is improving relative to its signal line, a classic sign that downside pressure is easing and that upward momentum is building from a low base. It is not a breakout signal on its own, but it is a meaningful shift beneath the surface.
Volatility & Volume
Volatility is elevated. The ATR(14) at 1,100.71, equal to 9.2% of the share price, shows the stock can move sharply even when the headline change looks small. That matters because a narrow Bollinger squeeze paired with a high ATR can produce abrupt swings once price leaves the range. Traders watching the chart should read this as a setup for expansion, not stability.
Volume, however, is the weak link in the current tape. The latest volume of 1,239 versus a 20-hour average of 3,661,340 indicates extremely quiet participation. Thin volume means the day’s price action carries less conviction, especially in a large-cap stock where institutional flow usually matters. Yet the OBV is rising, which is notable because On-Balance Volume measures whether money flow is accumulating even when the printed volume looks dull. That divergence suggests underlying demand may be improving before it becomes obvious in the headline turnover.
Key Levels & Scenarios
The nearest technical floor is 11,460.00, the stated support level and also close to the lower Bollinger band at 11,465.90. That alignment is useful because it gives the market a clear area where buyers have previously shown up. On the upside, 12,476.00 is the immediate resistance, sitting just above the upper Bollinger band at 12,417.70. A move through that area would matter because it would show the stock escaping the current squeeze and testing a more decisive range break.
If AstraZeneca holds above 11,941.80 and starts pressing 12,417.70 to 12,476.00, the chart would begin to favour a stronger recovery attempt. If it fails to hold 11,460.00, the technical tone would weaken quickly, because that would place price below both the lower band and the defined support zone. The fact that the stock is currently near the middle of the range means neither side has yet won control.
Technical Verdict: HOLD (wait & see)
HOLD (wait & see) fits the chart best because the signals are split: the stock is above SMA20 and the MACD histogram is positive, but the Stochastic is overbought and price remains below SMA50. The Bollinger squeeze also suggests a larger move may be coming, but not yet in a direction that is confirmed. The verdict is invalidated if price falls below 11,460.00, because that would break support and weaken the current base.
- Ideal Entry Range: 11,941.80 to 11,465.90
- Exit Target: 12,417.70 to 12,476.00
- Stop Loss protection: below 11,460.00
In plain English: the share price looks like it is pausing before choosing a direction, not yet ready to prove a durable trend.
The latest support level remains 11,460.00 GBp.
Summary Data AstraZeneca
| Last price | 11,962.00 GBp |
| Change 1 day / 5 days / 1 month | -0.07% / -1.22% / 4.02% |
| Trend / MA-cross | sideways / none |
| SMA20 / SMA50 | 11,941.80 / 12,727.24 |
| RSI (14) / Stochastic %K | 44.7 / 95.9 |
| Bollinger %B / ATR | 52% / 1,100.71 |
| Support / Resistance 20 days | 11,460.00 / 12,476.00 |
| Data as of | 1 September 2026 23:38 WIB |
Track AstraZeneca share price daily: live levels, support/resistance and our full AstraZeneca analysis history.



