CVX Stock Technicals Today: Gains 2.38%, RSI Overbought
On September 2, 2026: price 211.05 USD, trend uptrend, RSI 70.7, support 186.41, resistance 211.05. technical analysis of cvx stock. CVX Stock Technicals —…
Chevron Corp. shares on the NYSE rose to 211.05 USD on 1 September 2026, up 2.38% from the previous close of 206.14, according to Yahoo Finance data. The move extends a short-term advance of 5.58% over 5 days and 10.85% over 1 month, with the stock now pressing the top of its recent range. That matters because when a large-cap energy name reaches the upper edge of a measured move, the market is usually asking a simple question: is this a clean breakout, or just a pause after a fast run?
Trend & Price Action
Chevron remains in an uptrend, and the structure is still constructive because price sits above the SMA20 at 199.77 and well above the SMA50 at 188.91. In plain terms, the short-term average is already above the longer one, which tells traders the recent pace of buying has been strong enough to keep the trend aligned upward even without a new moving-average crossover. The SMA20 slope, up 1.38% over 5 days, reinforces that the trend is not just elevated but still rising.
The chart also shows price trading at the very top of its 20-day range, with 211.05 matching the stated resistance at 211.05 and sitting just beneath the Bollinger upper band at 212.74. That positioning is important: it suggests the stock is not drifting upward slowly, but is being pushed into a zone where momentum can either extend or cool quickly. The 3-month high of 211.08 is effectively being tested in real time.
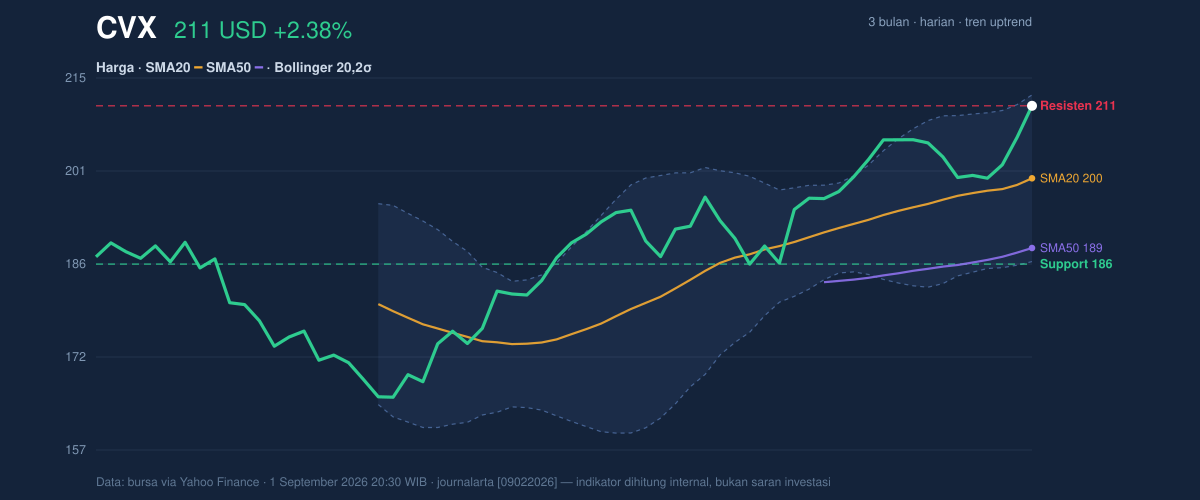
A close above the recent ceiling would signal that buyers are still in control. A failure here would say the market is pausing, not collapsing.
Oscillators & Momentum
The momentum picture is strong, but also stretched. RSI(14) at 70.7 and Stochastic %K at 99.8 with %D at 78.1 both point to an overbought condition. For general readers, “overbought” does not mean the stock must fall; it means the pace of buying has been fast enough that the market may be more vulnerable to a pullback or sideways digestion. In other words, the trend is still up, but the stock is no longer cheap in momentum terms.
That caution is partly offset by the MACD. MACD at 4.385 is above the signal line at 4.240, with a positive histogram of 0.145. This is the classic sign that upward momentum is still intact, even if it has become a little extended. When MACD stays above its signal line while RSI is over 70, the message is usually not “trend over,” but “trend strong, timing less forgiving.”
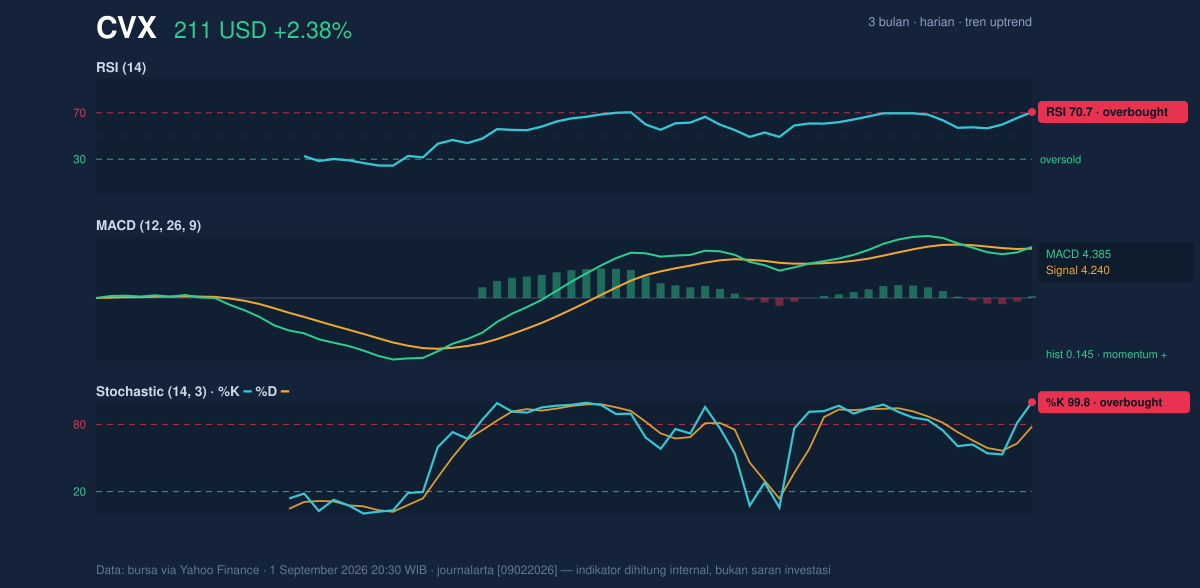
So the oscillators agree on direction, but not on comfort.
Volatility & Volume
Chevron’s Bollinger upper band at 212.74 sits close above the last price, while the band width of 13.0% is described as normal rather than compressed. That combination suggests the stock is not in a volatility squeeze that typically precedes a sudden expansion, but neither is it in a chaotic phase. The market is moving with enough order for trend-following behavior, yet it is approaching a zone where short-term gains can become harder to sustain.
The ATR(14) of 3.84, equal to 1.8% of price, points to moderate volatility. That means daily swings are meaningful but not extreme. Volume adds confirmation: the latest print of 8,551,500 shares is about 1.1× the 20-day average of 7,933,960, and OBV is rising. OBV, or on-balance volume, tracks whether volume is accumulating in the direction of price. Rising OBV alongside a price breakout attempt is usually a sign that the move has broader participation, not just a thin late-session push.
Still, participation is strongest when price is not already pinned to resistance. That is the tension here.
Key Levels & Scenarios
The nearest support is the 20-hour low at 186.41, while the immediate resistance is 211.05. With price already at 100% of the stated range, the stock is effectively testing the upper boundary rather than building a base below it. The 3-month low of 164.78 is far enough away that the medium-term trend remains intact, but it is not the operative level for near-term trading behavior.
If Chevron can clear 211.05 and hold above the 212.74 Bollinger upper band, that would confirm a continuation attempt with momentum backing it. If it fails to hold 211.05, the first sign of cooling would be a retreat toward the 199.77 SMA20, where the trend would be tested for support rather than celebrated for breakout strength.
Technical Verdict: HOLD (wait & see)
HOLD (wait & see) fits best because the trend is still positive, but momentum is stretched and price is pressing directly into resistance.
- Reason 1: Price remains above the SMA20 and SMA50, which keeps the trend structure bullish.
- Reason 2: MACD is above its signal line and the histogram is positive, so momentum is still confirming the uptrend.
- Reason 3: RSI at 70.7 and Stochastic at 99.8 show the move is already extended, making follow-through less certain near resistance.
- Verdict invalidated if price breaks below 186.41, the stated 20-hour support.
- Ideal Entry Range: 199.77 to 211.05
- Exit Target: 212.74
- Stop Loss protection: 186.41
In plain English: Chevron still looks strong, but it is close enough to resistance that the next move matters more than the last one.
The next market read comes from whether the stock can keep holding above 211.05 after this latest push.
Summary Data CVX
| Last price | 211.05 USD |
| Change 1 day / 5 days / 1 month | 2.38% / 5.58% / 10.85% |
| Trend / MA-cross | uptrend / none |
| SMA20 / SMA50 | 199.77 / 188.91 |
| RSI (14) / Stochastic %K | 70.7 / 99.8 |
| Bollinger %B / ATR | 93% / 3.84 |
| Support / Resistance 20 days | 186.41 / 211.05 |
| Data as of | 1 September 2026 20:30 WIB |
Track CVX stock price daily: live levels, support/resistance and our full CVX analysis history.



