DBS Stock Technicals Today: Gains 1.00%, Testing Key Resistance
On September 2, 2026: price 76.91 SGD, trend uptrend, RSI 64.1, support 73.55, resistance 77.40. technical analysis of dbs stock. DBS Stock Technicals — full…
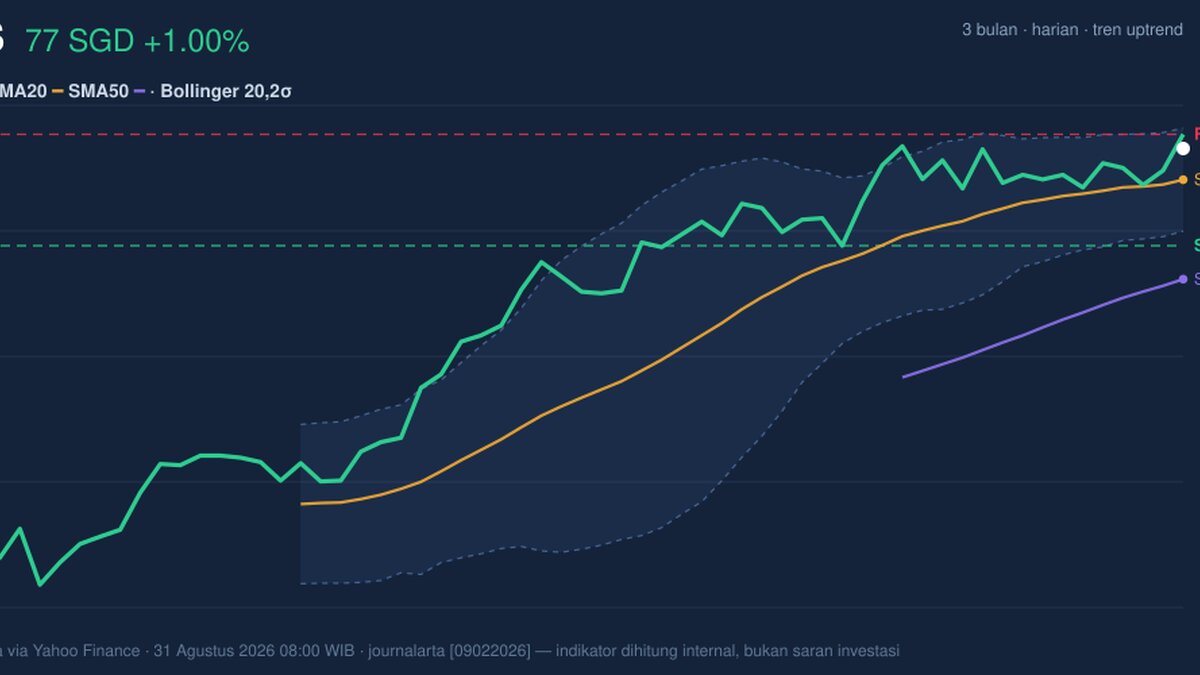
DBS Group’s shares rose to SGD 76.91 on SGX, up 1.00% from the previous close of 76.15, with the stock now sitting near the top of its recent trading band. The move matters less as a one-day gain than as a test of whether the market is willing to keep paying up after a 3.90% climb over the past month and a 1.79% rise over five days. As shown in the chart, price is still above both the SMA20 at 75.83 and the SMA50 at 72.39, which keeps the broader structure pointed upward, even though the short-term signals are starting to look stretched.
Trend & Price Action
The key message from the price structure is simple: DBS remains in an uptrend, but it is now trading with less room for error. The stock is above its SMA20, and that moving average is still rising at 0.64% over five days, which means recent buyers have been willing to step in at higher levels. The absence of a fresh MA-cross is also important: there is no new signal of trend acceleration, so the current move looks more like continuation than a new breakout phase.
That said, the stock is already near the upper edge of the recent range. The 20-day resistance at 77.40 is only a short distance above the last price, while the 20-day support at 73.55 sits well below. The stock is trading at roughly 87% of its range, which tells readers the market has already done much of the work needed to get back toward the top of the band. In plain language, DBS is not cheap on a short-term chart; it is being priced as a name with momentum, and that can attract buyers only as long as the ceiling holds or gives way.
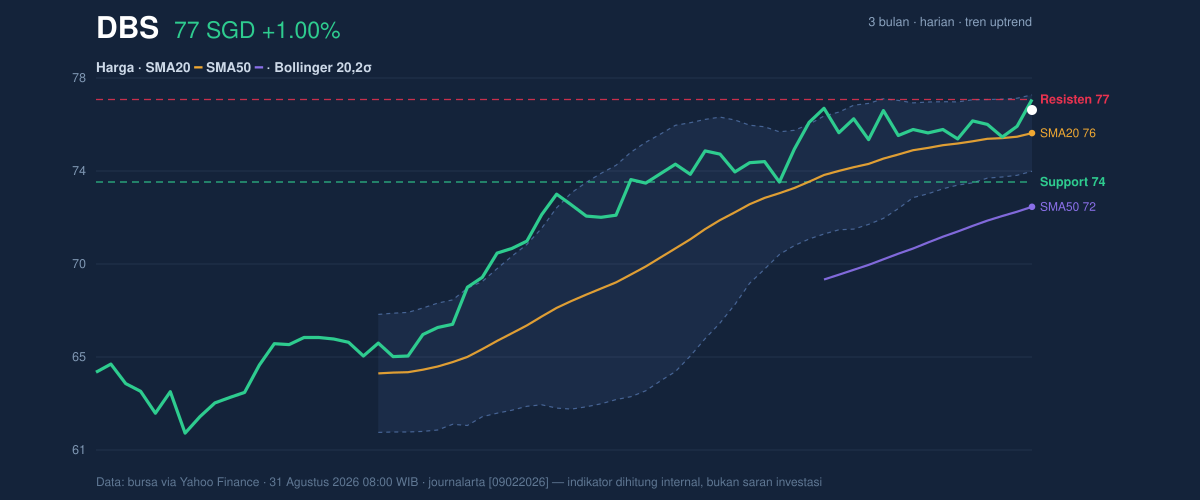
The broader reference point is the 3-month high at 77.97, which is close enough to matter. If the share price pushes through the current resistance zone, the chart would begin to suggest that the market is willing to challenge that prior peak rather than simply oscillate beneath it. If it stalls here, the recent rise starts to look like a mature advance rather than the start of a fresh leg higher.
Oscillators & Momentum
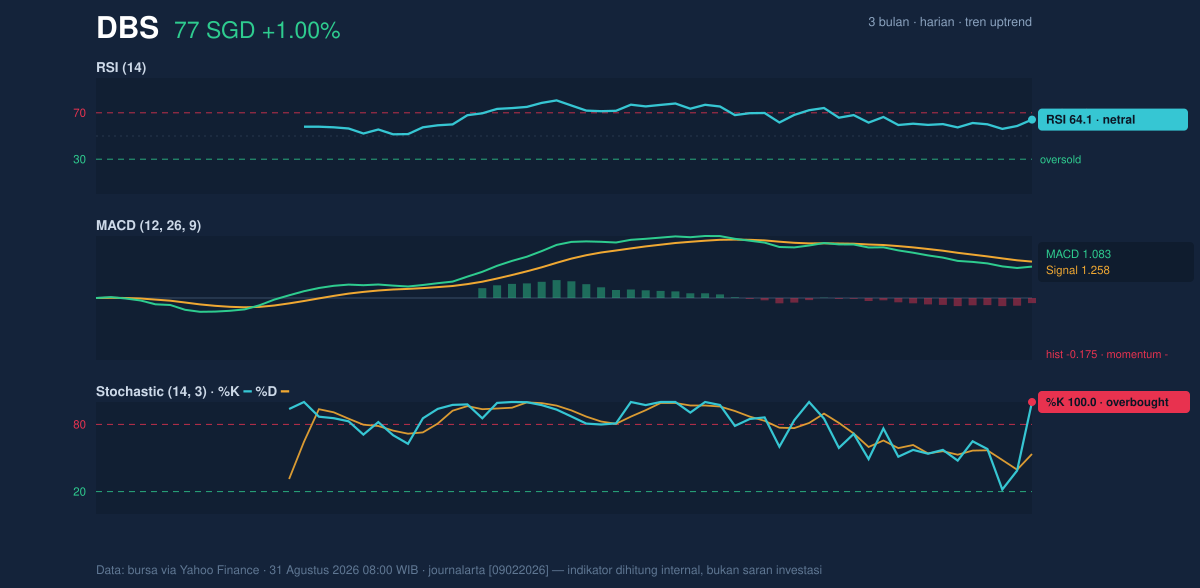
The momentum picture is more mixed than the trend picture. RSI at 64.1 is still technically neutral, but it is edging toward the upper end of the scale, which means the stock is gaining strength without yet flashing a full overbought warning. The more cautionary signal comes from Stochastic %K at 100.0 versus %D at 53.5: that is an overbought reading, and it says the latest push has been fast enough to leave the short-term oscillator fully stretched.
The MACD at 1.083, however, is below its signal line at 1.258, with a histogram of -0.175. That negative histogram is the chart’s way of saying upside momentum is no longer as strong as the price action alone might suggest. In other words, DBS can still be in an uptrend while momentum cools underneath it; that is often how a pause begins before the market decides whether to consolidate or extend.
The combination matters more than any single number. Price is still rising, but the oscillators are no longer all pointing in the same direction. That is usually what traders watch when a stock is pressing into resistance: strong enough to hold the trend, but not yet clean enough to remove the risk of a short-term pullback.
Volatility & Volume
Volatility is subdued, and that can be a setup for a sharper move if price escapes the current band. The ATR(14) at 1.14 is only 1.5% of the share price, which means daily swings have been relatively contained. At the same time, the Bollinger Bands are narrowing, with a 4.7% band width. A squeeze like that often signals compression rather than indecision: the market is storing energy, and the next move can be larger than recent trading has implied.
The position within the band is also telling. With %B at 80%, DBS is trading in the upper part of its Bollinger envelope, which is consistent with strength but also leaves less cushion if buyers hesitate. The stock is not breaking down; it is pressing upward while volatility tightens. That combination can be constructive, but it can also produce false starts if momentum fails to confirm.
Volume and breadth are the better part of the story. Last volume was 6,652,800, about 1.5× the 20-hour average of 4,506,266, and OBV is rising. That means the move has been backed by participation rather than thin trading. Rising on heavier volume is usually a healthier sign than drifting upward quietly; it suggests the market is not merely marking time, but actively accumulating shares.
Key Levels & Scenarios
The immediate map is clear. Resistance at 77.40 is the first test, with the 3-month high at 77.97 just above it. A decisive move through that area would shift attention to whether DBS can convert a compressed, high-volume advance into a stronger breakout. On the downside, support at 73.55 is the first level that would need to hold for the current uptrend to remain intact. Below that, the chart would start to lose its short-term structure and the recent rally would look more fragile.
The important signal here is not whether DBS is strong — it is — but whether strength is still being confirmed by momentum. Right now, price and volume are supportive, while oscillators are less enthusiastic. That is why the chart is interesting: it is close to a decision point rather than a settled trend.
Technical Verdict: HOLD (wait & see)
HOLD (wait & see)
- Reason 1: Price remains above the SMA20 at 75.83 and SMA50 at 72.39, keeping the trend constructive.
- Reason 2: MACD is below the signal line and the Stochastic is overbought, which warns that momentum is tiring even as price holds up.
- Reason 3: Bollinger Bands are squeezing and volume is running at 1.5× normal with OBV rising, so the next move could be meaningful but is not yet confirmed.
- Verdict invalidated if price breaks below 73.55, which would weaken the short-term structure and challenge the current uptrend.
- Ideal Entry Range: 75.83 to 73.55
- Exit Target: 77.40 to 77.97
- Stop Loss Protection: below 73.55
In plain English, DBS still looks firm, but the chart is asking for proof before the next leg is trusted. “It’s strong, but it needs to show it can keep going.”
Summary Data DBS
| Last price | 76.91 SGD |
| Change 1 day / 5 days / 1 month | 1.00% / 1.79% / 3.90% |
| Trend / MA-cross | uptrend / none |
| SMA20 / SMA50 | 75.83 / 72.39 |
| RSI (14) / Stochastic %K | 64.1 / 100.0 |
| Bollinger %B / ATR | 80% / 1.14 |
| Support / Resistance 20 days | 73.55 / 77.40 |
| Data as of | 31 Agustus 2026 08:00 WIB |
Track DBS share price daily: live levels, support/resistance and our full DBS analysis history.



