Death Cross Pressure, AAPL Stock Gains 2.61% Today
On September 2, 2026: price 325.13 USD, trend sideways, RSI 60.6, support 302.25, resistance 325.13. technical analysis of aapl stock. Death Cross Pressure —…
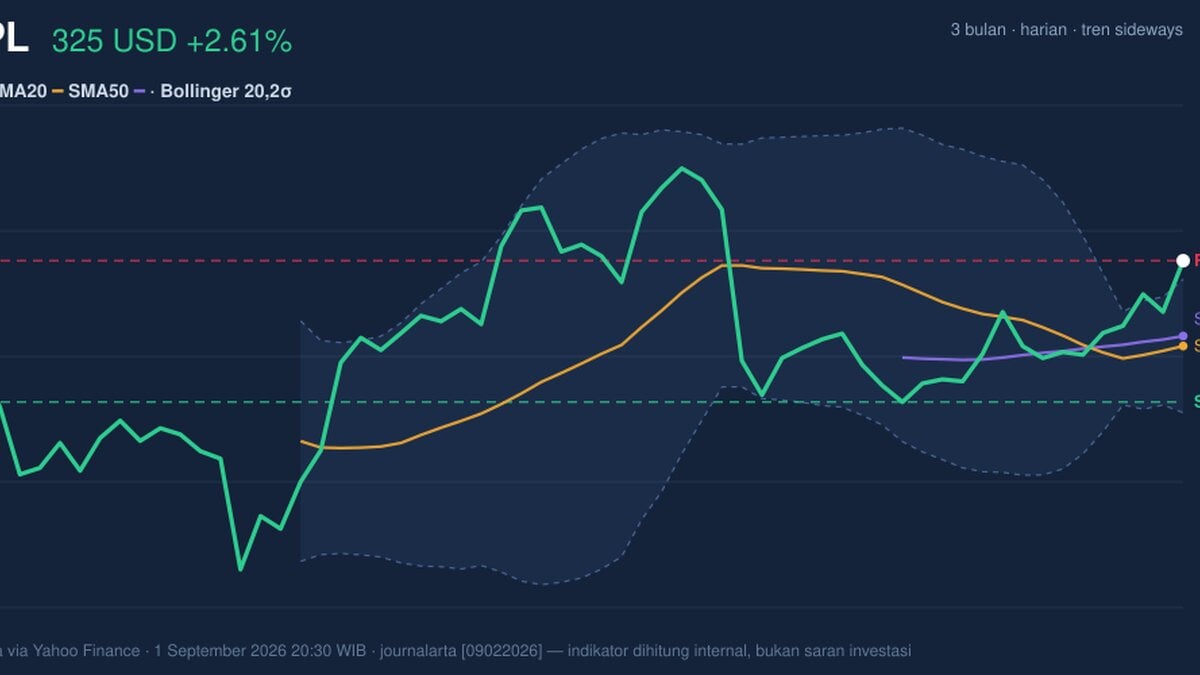
Apple’s shares on Nasdaq rose to 325.13 USD in the latest session, up 2.61% from the prior close of 316.85, according to Yahoo Finance data cited in the market feed. The move matters because it pushed the stock right to the top of its short-term trading range, with price now sitting at 100% of the 20-hour range and pressing against the latest resistance. That is a sign of strength, but not a clean breakout yet.
Trend & Price Action
The broader message from the chart is still mixed. Apple is trading above SMA20 at 311.32 and above SMA50 at 312.94, which normally signals that the market is willing to pay up above recent averages. But the averages themselves tell a more cautious story: the trend is described as sideways, and the SMA20 slope is -0.06% over 5 days, meaning the short-term average is still drifting lower even as price has bounced. That combination often shows a stock trying to recover inside a range rather than launching into a sustained trend.
The more important technical wrinkle is the death cross, where the SMA20 has moved below the SMA50. In plain language, that means recent price behavior has been weaker than the intermediate trend, and many market participants read it as a warning that rallies may need fresh confirmation before they can extend. Still, the current price above both averages shows that buyers have recently reclaimed control of the tape, at least for now.
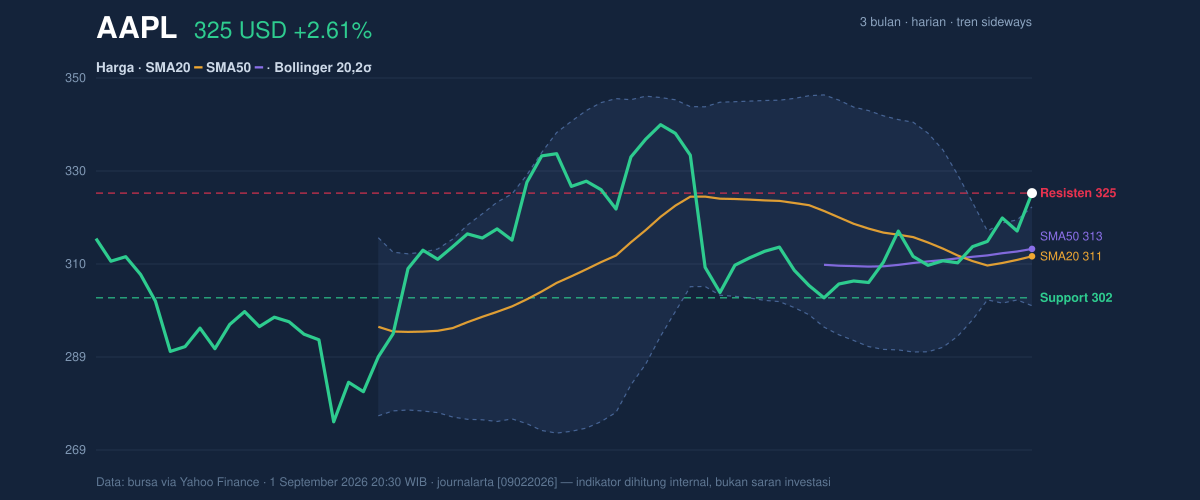
The position in the broader range also gives context. Apple’s 3-month high is 344.57 and the 3-month low is 273.75, so the stock is trading in the upper half of that band, but not near the peak. That matters because a stock can be strong without being fully resolved; it can also be vulnerable if momentum fades after a sharp move into resistance.
Oscillators & Momentum
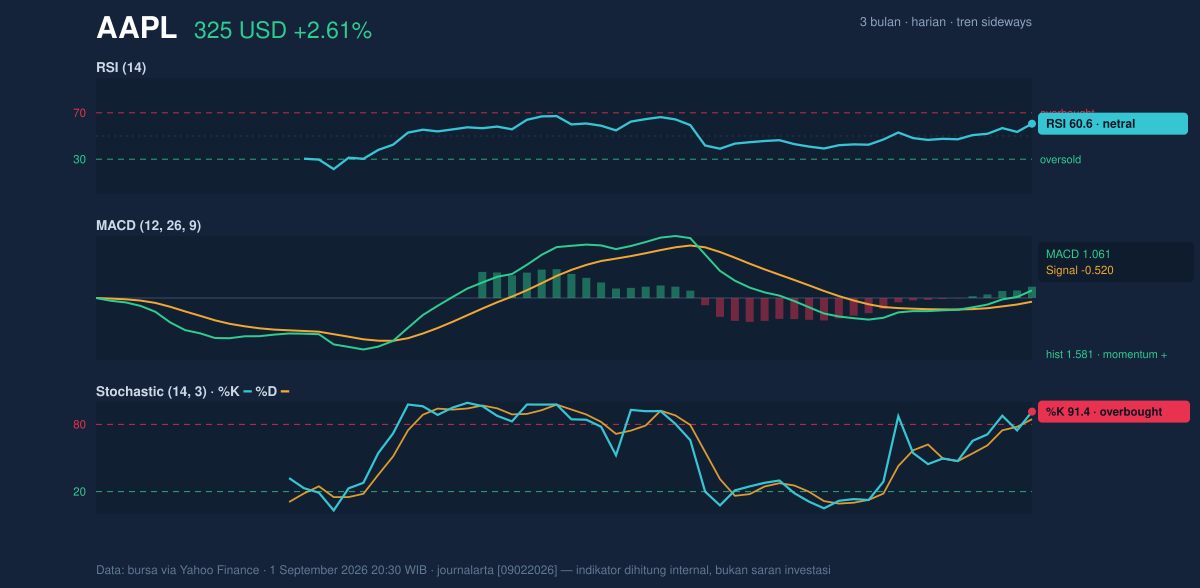
Momentum indicators are where the picture becomes more nuanced. The RSI at 60.6 is still neutral, which means the stock is not yet in the kind of stretched condition that usually triggers immediate caution on its own. But the Stochastic %K at 91.4 and %D at 84.6 are both in overbought territory. In practical terms, that suggests the latest rally has moved quickly enough that near-term upside may be getting crowded, even if the broader trend has not turned down.
That overbought reading does not automatically mean a reversal is imminent. It means the stock is extended relative to recent trading and may need either a pause or a fresh burst of buying to keep climbing. The MACD at 1.061, with the signal line at -0.520 and a histogram of 1.581, points the other way: momentum is still positive and improving. When MACD is above its signal line and the histogram is positive, it usually means the recent move has more force than the prior trend. So Apple is showing a classic split: the oscillator most sensitive to short-term stretch is overheated, while the trend-following momentum gauge is still constructive.
Volatility & Volume
The volatility setup supports the idea that the stock may be preparing for a larger move. The Bollinger upper band is 322.11, the middle band is 311.32, and the lower band is 300.53. With %B at 114%, Apple is trading above the upper band, which usually signals a powerful push beyond the recent statistical range. That can be bullish if it turns into a sustained expansion, but it can also mean the stock is temporarily overextended.
The Bollinger band width of 6.9% is relatively tight and described as a squeeze. A squeeze often precedes a breakout because price compression tends to store energy. In other words, the market has been quiet enough to build pressure, and the latest jump may be the first sign that pressure is being released. The key question is whether the move continues with follow-through or slips back into the band.
Volume argues that the move has participation behind it. Last session volume was 53,119,500, compared with a 20-day average of 40,623,785, or about 1.3× normal. That is important because price advances on thin volume can be fragile; here, the rally arrived with above-average trading, and OBV is rising, which suggests that accumulation has been present beneath the surface. In simple terms, more shares are changing hands on up days than on down days, which usually improves the credibility of a move.
Key Levels & Scenarios
The nearest line in the sand is the latest resistance at 325.13, which is also the current last price. That makes the session especially important: Apple is effectively testing whether the market is willing to accept prices above this level or whether sellers will force a retreat. On the downside, the most immediate support is 302.25. That level matters because it is the lower edge of the recent 20-hour range and sits well below the current price; losing it would suggest the breakout attempt has failed and the stock is slipping back toward its prior consolidation zone.
A useful way to read the setup is conditional. If Apple can hold above the upper Bollinger band and remain above 325.13 resistance with volume, the chart would confirm that the squeeze is resolving upward. If it cannot hold that area, the stock may drift back toward 311.32, where the middle Bollinger band and SMA20 converge, and then toward 302.25 if momentum fades.
Technical Verdict: HOLD (wait & see)
HOLD (wait & see) fits the current setup best because the chart shows strength, but not yet clean confirmation.
- Reason 1: MACD is positive and the histogram remains strong, which supports the recent advance.
- Reason 2: Volume is 1.3× normal and OBV is rising, so the move has participation.
- Reason 3: The stock is also overbought on Stochastic and sitting above the Bollinger upper band, which raises the risk of a pause after the jump.
- Verdict invalidated if price falls below 302.25, because that would break the nearest support and weaken the breakout case.
- Ideal Entry Range: 311.32 to 302.25
- Exit Target: 325.13, then the next test would be the 3-month high at 344.57
- Stop Loss protection: below 302.25
In plain English: Apple looks stronger than it did a few sessions ago, but the chart still needs proof that this jump is more than a short-lived stretch.
Summary Data AAPL
| Last price | 325.13 USD |
| Change 1 day / 5 days / 1 month | 2.61% / 4.91% / 5.09% |
| Trend / MA-cross | sideways / death |
| SMA20 / SMA50 | 311.32 / 312.94 |
| RSI (14) / Stochastic %K | 60.6 / 91.4 |
| Bollinger %B / ATR | 114% / 6.66 |
| Support / Resistance 20 days | 302.25 / 325.13 |
| Data as of | 1 September 2026 20:30 WIB |
Track AAPL stock price daily: live levels, support/resistance and our full AAPL analysis history.



