HSBC Stock Drops 0.50% Today, Testing Support Level
On September 2, 2026: price 160.60 HKD, trend sideways, RSI 50.2, support 160.10, resistance 166.50. technical analysis of hsbc stock. HSBC Stock Drops — full…
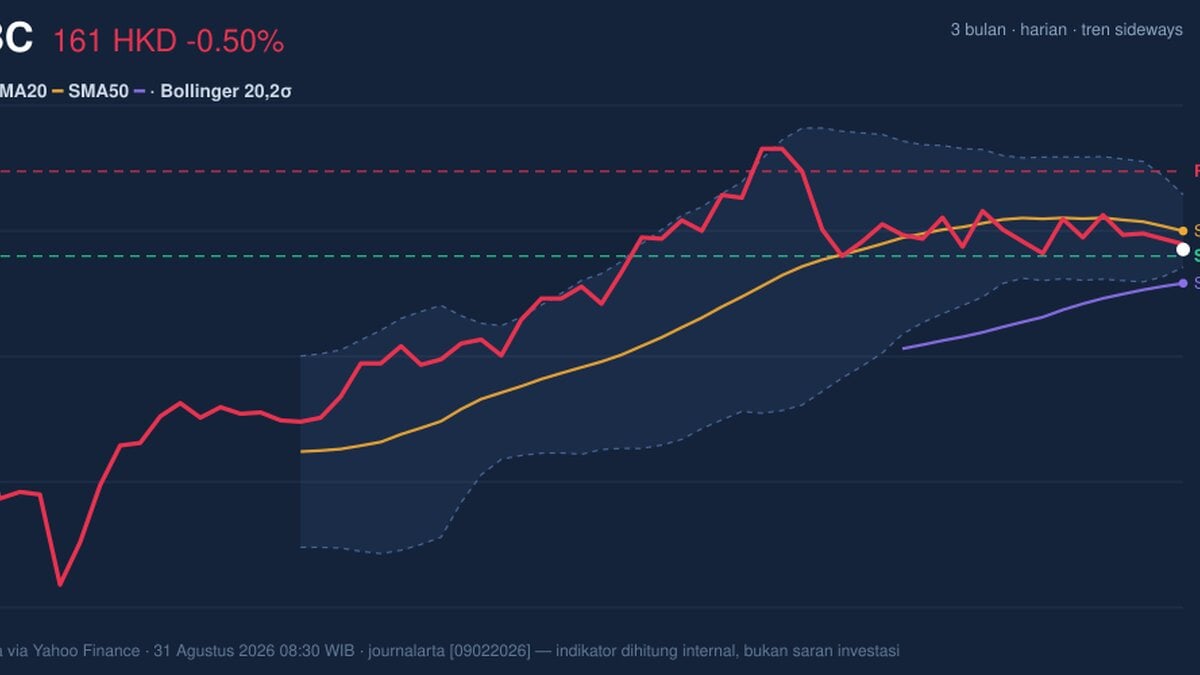
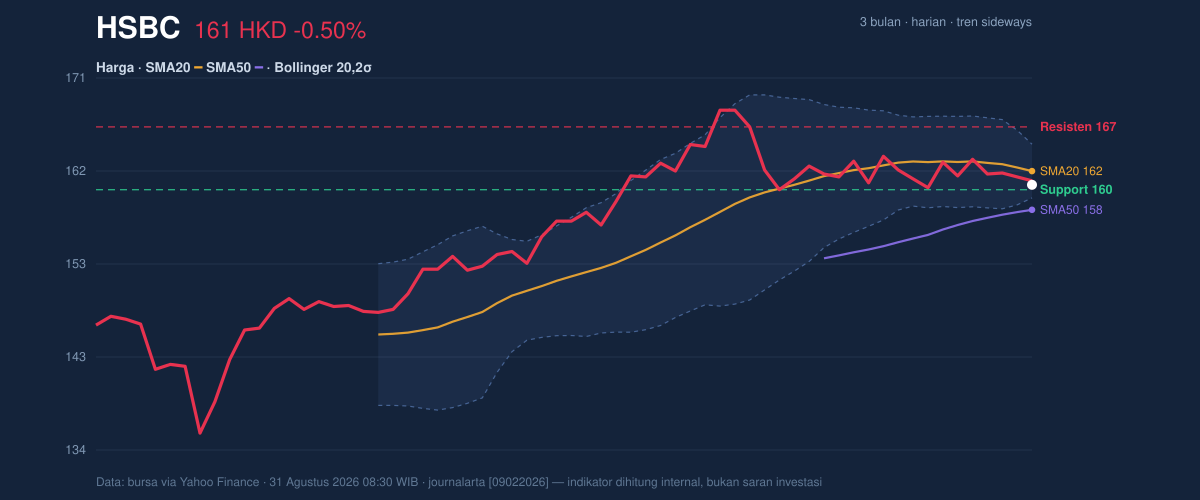
HSBC Holdings traded at 160.60 HKD in Hong Kong on 31 August 2026, slipping 0.50% from the previous close of 161.40 as the share stayed below its SMA20 at 161.99 but above its SMA50 at 158.05. That positioning matters: it says the stock is not in a clean uptrend, yet it is also not breaking down decisively. The chart shows a market still trapped in a sideways range, with short-term pressure from fading momentum offset by a longer-moving base that has not been lost.
Trend & Price Action
The price structure is mixed rather than bearish. The stock is trading below the SMA20, and the 20-day average itself is sloping down by -0.57% over 5 days, which signals that recent trading has been leaning lower. At the same time, there is no fresh MA-cross, so the market has not delivered the kind of moving-average confirmation that usually marks a stronger directional turn. In plain terms, the short-term trend is soft, but the medium-term trend has not been broken.
HSBC remains in a sideways pattern, and that is reinforced by the fact that the share is only 8% through the 20-hour range between 160.10 support and 166.50 resistance. The current price is sitting close to the lower half of that band, which implies the market is still testing whether buyers can defend the floor rather than pushing into a fresh advance.
That matters because sideways markets often look calm right before they are not. A narrow structure can persist for a while, but once price leaves the range, the move can be sharper than the day-to-day drift suggests.
Oscillators & Momentum
The momentum picture is cautious. The RSI at 50.2 is effectively neutral, meaning HSBC is neither stretched on the upside nor washed out on the downside. That usually tells analysts the stock is in a waiting zone: buyers and sellers are roughly balanced, but neither side has enough conviction to force a trend. The Stochastic %K at 31.9 and %D at 40.4 are also neutral, though the faster line sitting below the slower one suggests near-term momentum has been weaker than the broader neutral reading implies.
The clearest signal comes from the MACD. The MACD at 0.752 sits below the signal line at 1.241, leaving a negative histogram of -0.489. For general readers, that means the stock’s recent pace is lagging its own trend benchmark: price is not collapsing, but the engine underneath has lost some thrust. That is an important distinction. A negative histogram does not always mean a fall is imminent, but it does mean rallies can struggle unless fresh demand appears.
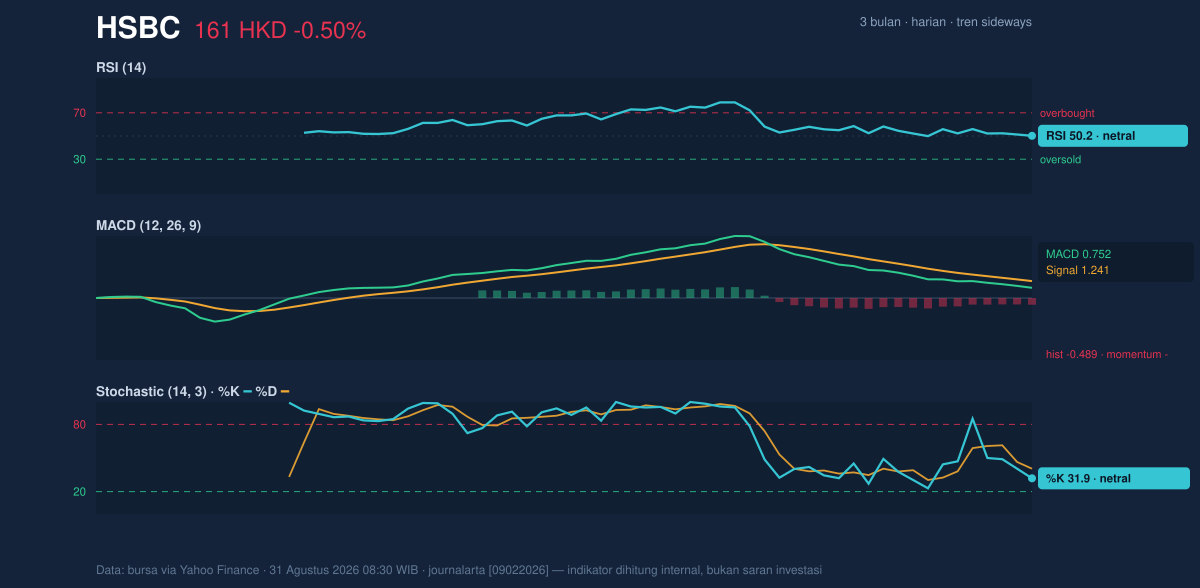
RSI is neutral, Stochastic is neutral, and MACD is negative — a combination that usually points to consolidation with a slight downside bias, rather than a strong directional breakout already underway.
Volatility & Volume
Volatility is subdued. The ATR(14) at 2.20, equal to about 1.4% of the share price, indicates relatively low day-to-day movement. That can make the stock look stable, but it also means any move outside the current band may stand out more clearly. The Bollinger Bands reinforce that message: the upper band is 164.73, the middle band is 161.99, and the lower band is 159.26. With %B at 25%, price is sitting in the lower quarter of the band structure, which shows it is closer to the downside edge than the upside edge.
Just as important, the Bollinger width is only 3.4% and is described as a squeeze. A squeeze means the bands have narrowed, usually because recent volatility has compressed. That does not predict direction by itself, but it does warn that the stock may be storing up a larger move. The question is whether that move comes from a rebound through the middle band or a slip through support.
Volume has not yet confirmed a stronger turn. Last volume was 6,579,275, well below the 20-hour average of 10,500,802, or about 0.6× normal. Lower volume on a soft price day often means conviction is limited, but it also means the market has not attracted enough participation to force a recovery. The OBV is falling, which is a quieter but important warning: on-balance volume tracks whether trading flow is accumulating or being distributed, and a decline suggests sellers have had the upper hand in the background.
Key Levels & Scenarios
160.10 is the immediate support to watch, and 166.50 is the nearest resistance. The price is currently below the 161.99 SMA20 and just above the 159.26 Bollinger lower band, so the market is hovering in a zone where support can matter quickly. If 160.10 gives way, the lower band at 159.26 becomes the next technical marker; losing that area would increase the risk that the share revisits the 158.05 SMA50.
On the upside, a move back above 161.99 would be the first sign that the recent soft patch is easing. A stronger recovery would need to clear 164.73 and then challenge 166.50, because that is where the current range ceiling sits. Without that, any bounce still looks like a move inside a range rather than a trend change.
Technical Verdict: HOLD (wait & see)
HOLD (wait & see)
- MACD is negative, showing momentum has weakened even though the broader price structure is not broken.
- RSI at 50.2 and Stochastic at 31.9 / 40.4 are neutral, which argues against forcing a directional call.
- Bollinger Bands are squeezed, so the stock may be preparing for a larger move, but direction is not yet confirmed.
Verdict invalidated if price breaks below 159.26, because that would mean the lower Bollinger band and nearby support have failed together.
- Ideal Entry Range: 159.26 to 161.99
- Exit Target (Target Price): 164.73 to 166.50
- Stop Loss protection: below 159.26, with 158.05 as the deeper technical line
For non-traders: HSBC is sitting in a tight range, and the next decisive move will matter more than today’s small drift.
Last volume: 6,579,275, versus a 20-hour average of 10,500,802.
Summary Data HSBC
| Last price | 160.60 HKD |
| Change 1 day / 5 days / 1 month | -0.50% / -0.56% / -4.52% |
| Trend / MA-cross | sideways / none |
| SMA20 / SMA50 | 161.99 / 158.05 |
| RSI (14) / Stochastic %K | 50.2 / 31.9 |
| Bollinger %B / ATR | 25% / 2.20 |
| Support / Resistance 20 days | 160.10 / 166.50 |
| Data as of | 31 Agustus 2026 08:30 WIB |
Track HSBC share price daily: live levels, support/resistance and our full HSBC analysis history.



