HSBC Stock Gains 0.33% Today, Momentum Weakens
On September 2, 2026: price 1,533.40 GBp, trend sideways, RSI 54.3, support 1,497.20, resistance 1,584.60. technical analysis of hsbc stock.
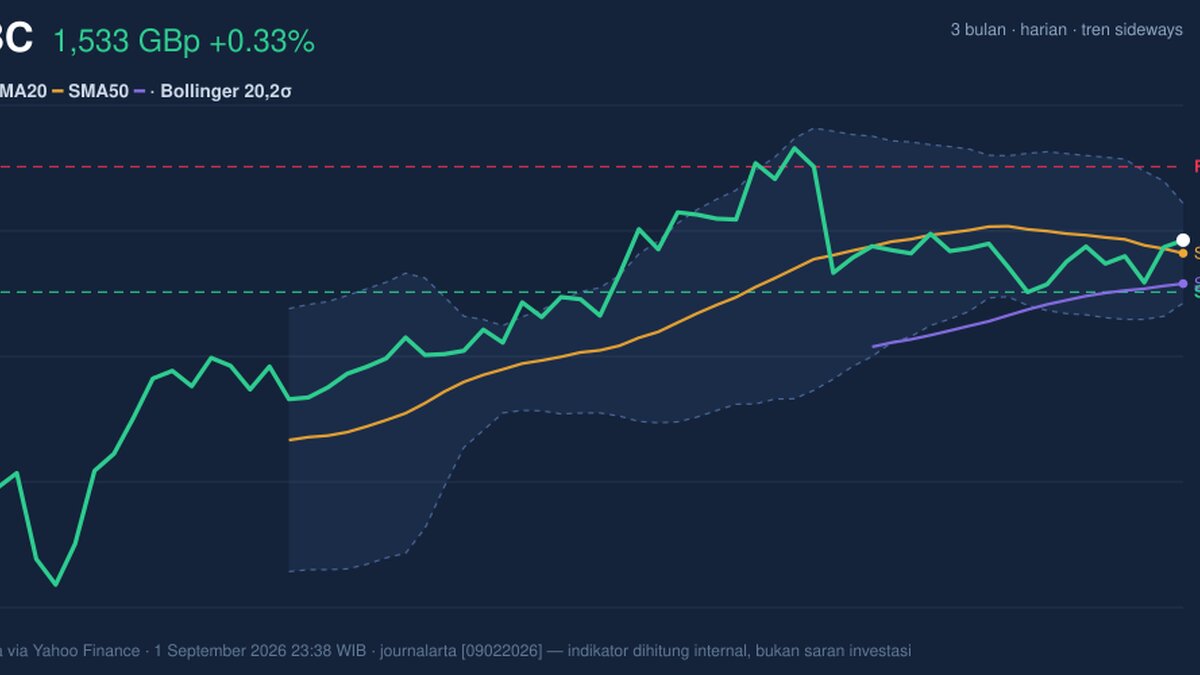
1,533.40 GBp is where HSBC Holdings begins September 2026 trading on the LSE, up 0.33% on the day and still holding above its SMA20 at 1,524.27, even as the broader pattern stays sideways. The share price is sitting in the upper half of its 20-hour range, but the message from the indicators is mixed: the trend is intact for now, yet momentum is not fully confirming it. As shown in the chart, HSBC is trading inside a tightening band, which often means the market is waiting for a clearer catalyst before choosing direction.
Trend & Price Action
The most important signal is that HSBC is still trading above both the SMA20 at 1,524.27 and the SMA50 at 1,503.14. That keeps the medium-term structure constructive, because price remains above the short- and medium-term averages rather than slipping below them. But the slope of the SMA20 at -0.82% over 5 days shows the short-term trend has been softening. In plain English, the stock is not trending strongly higher; it is drifting, with buyers still present but not forceful enough to push the shares decisively away from the recent band.
The absence of a fresh MA-cross matters too. A new moving-average cross often signals a change in trend direction; without one, the market is telling investors there is no confirmed breakout in either direction. That fits the broader sideways reading and the fact that HSBC is only 41% through the 1,497.20 to 1,584.60 range. It is closer to support than resistance, but not close enough to suggest a breakdown is underway.
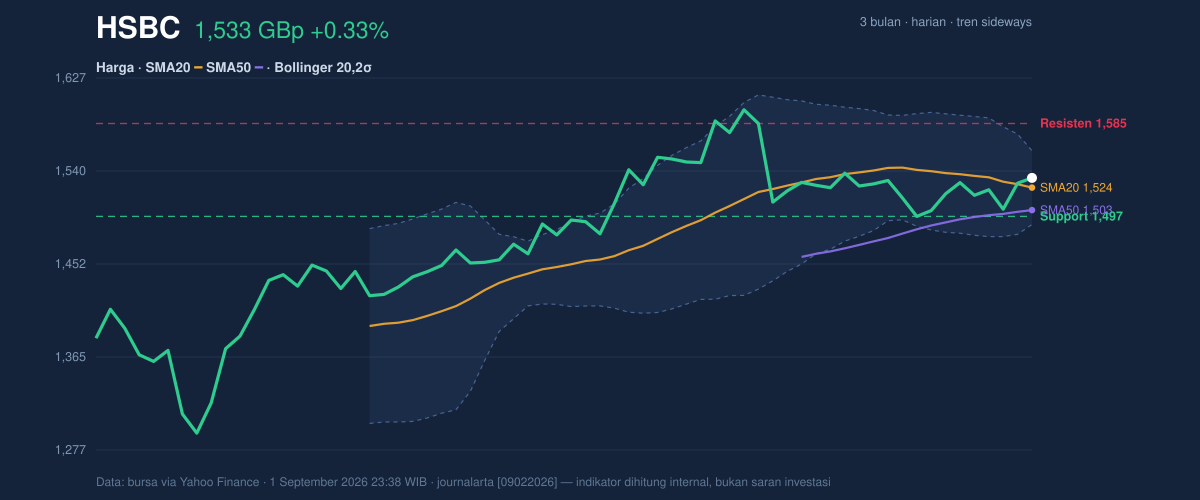
1,497.20 is the first level that matters on the downside, while 1,584.60 is the ceiling the market must clear to shift the conversation from consolidation to momentum.
Oscillators & Momentum
The oscillator picture is more cautious than the price chart. RSI at 54.3 is neutral, which means the shares are neither stretched nor oversold. That is usually a sign of balance, but in this case it also shows there is no strong momentum impulse behind the recent advance. The more telling signal comes from stochastic: %K at 99.2 versus %D at 61.1 is an overbought reading, suggesting the stock has moved quickly within the recent range and may be vulnerable to a pause or pullback. Overbought does not mean reversal by itself; it means the move has become crowded and may need to cool off.
The MACD line adds to that caution. MACD at 3.274 remains below the signal at 5.315, with a -2.041 histogram. That negative histogram is the clearest sign that upward momentum is fading, even though price has not broken down. Put simply, HSBC is still holding its ground, but the internal engine is not as strong as the headline price suggests.
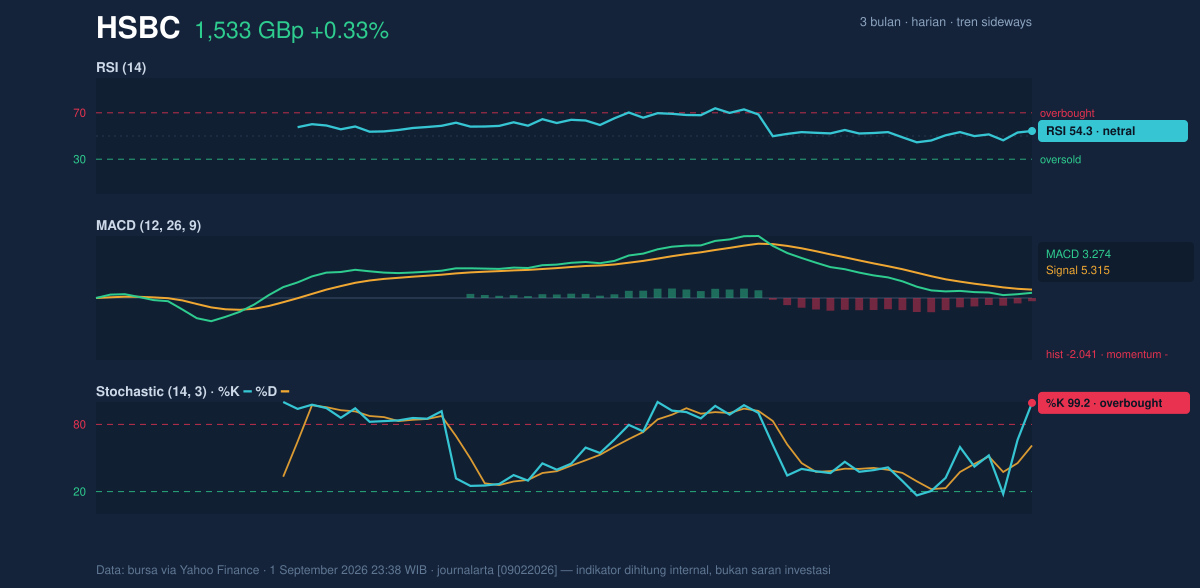
RSI is neutral, stochastic is overbought, and MACD momentum is negative — a combination that usually points to consolidation rather than a clean trend extension.
Volatility & Volume
Volatility is also a key part of the story. The Bollinger Band width of 4.6% is narrow, and the chart is showing a squeeze. That matters because squeezes often come before a sharper move once price escapes the band. HSBC is currently trading with %B at 63%, which places it above the midline but not near the upper band at 1,559.00. In practical terms, the shares are leaning upward within a compressed structure, but they are not yet pressing hard against resistance.
The ATR(14) of 131.20, equal to 8.6% of price, says the stock can still move sharply once it leaves this quiet phase. ATR measures average trading range, so a high reading like this tells readers not to mistake the current calm for low-risk stability. The market may be quiet now, but it is capable of a wider swing than the recent day-to-day move implies.
Volume, however, is the weak spot in the current setup. Last volume was 25,050 versus a 20-hour average of 24,833,919, described in the data as 0.0× sepi. That means the latest price action is not being backed by broad participation. When price rises on thin activity, the move is more fragile because it lacks confirmation from a larger pool of traders. The one offset is that OBV is rising, which suggests the longer-running balance of buying pressure has not completely deteriorated.
Rising OBV is a constructive backdrop, but very light volume means the latest bounce has not yet earned full credibility.
Key Levels & Scenarios
For the market to improve the technical tone, HSBC would need to push through 1,559.00 first, then challenge 1,584.60. A move through those levels would show the squeeze is resolving to the upside and that buyers are finally converting the tight range into a breakout attempt. On the downside, 1,524.27 is the immediate pivot because it is the SMA20 and the Bollinger midline, while 1,497.20 is the more important support from the 20-hour range. A break below that support would weaken the current sideways structure and raise the risk that the recent bounce was only a pause inside a larger consolidation.
The key message from the chart is simple: HSBC is not weak, but it is not yet strong enough to escape the range with conviction. The price is above trend support, yet momentum and participation are not fully aligned.
Technical Verdict: HOLD (wait & see)
HOLD (wait & see)
- Price is above SMA20 and SMA50, which keeps the broader structure constructive.
- MACD histogram is negative and stochastic is overbought, so momentum is not confirming the price level.
- Bollinger Bands are squeezing, which often means the next move may be sharper, but direction is not yet confirmed.
Verdict invalidated if price falls below 1,497.20, because that would break the nearest support and weaken the sideways base.
- Ideal Entry Range: 1,524.27 to 1,497.20
- Exit Target (Target Price): 1,559.00 to 1,584.60
- Stop Loss protection: below 1,497.20
For non-traders, this means HSBC is holding up, but the chart is still waiting for proof that the next move has real strength behind it.
OBV is rising while the latest volume remains extremely light.
Summary Data HSBC
| Last price | 1,533.40 GBp |
| Change 1 day / 5 days / 1 month | 0.33% / 0.29% / -4.01% |
| Trend / MA-cross | sideways / none |
| SMA20 / SMA50 | 1,524.27 / 1,503.14 |
| RSI (14) / Stochastic %K | 54.3 / 99.2 |
| Bollinger %B / ATR | 63% / 131.20 |
| Support / Resistance 20 days | 1,497.20 / 1,584.60 |
| Data as of | 1 September 2026 23:38 WIB |
Track HSBC share price daily: live levels, support/resistance and our full HSBC analysis history.



