MELI Stock Gains 1.41% Today, Momentum Gains
On September 2, 2026: price 1,963.49 USD, trend uptrend, RSI 59.6, support 1,779.14, resistance 1,997.00. technical analysis of meli stock.
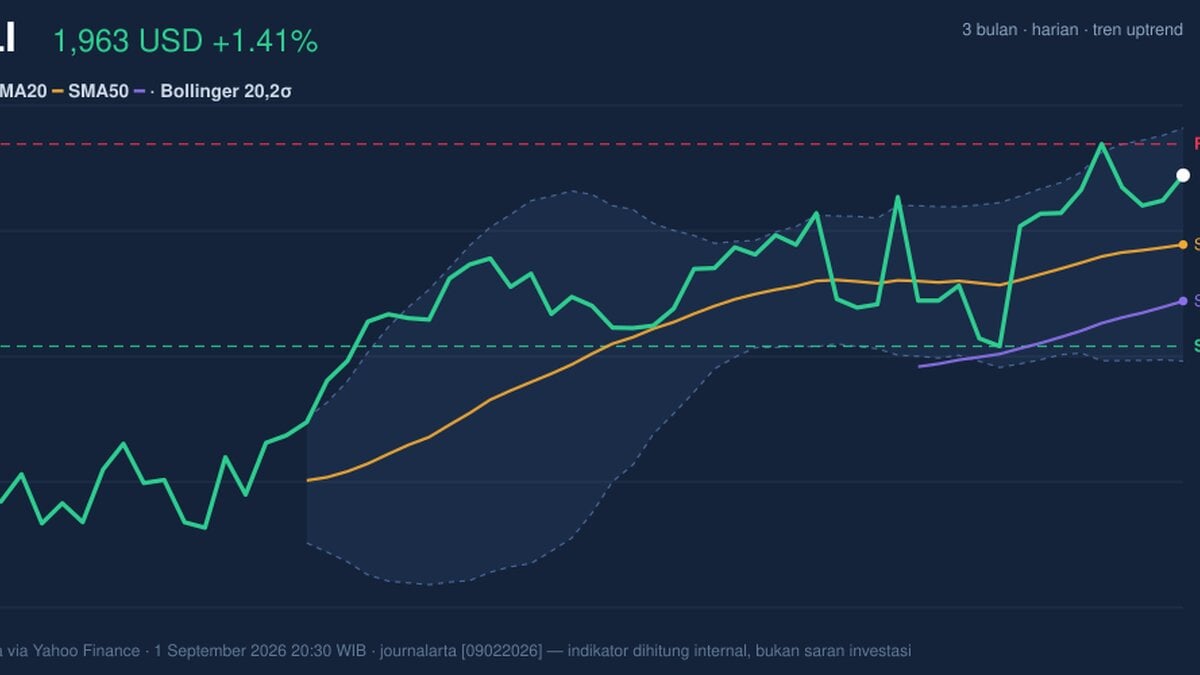
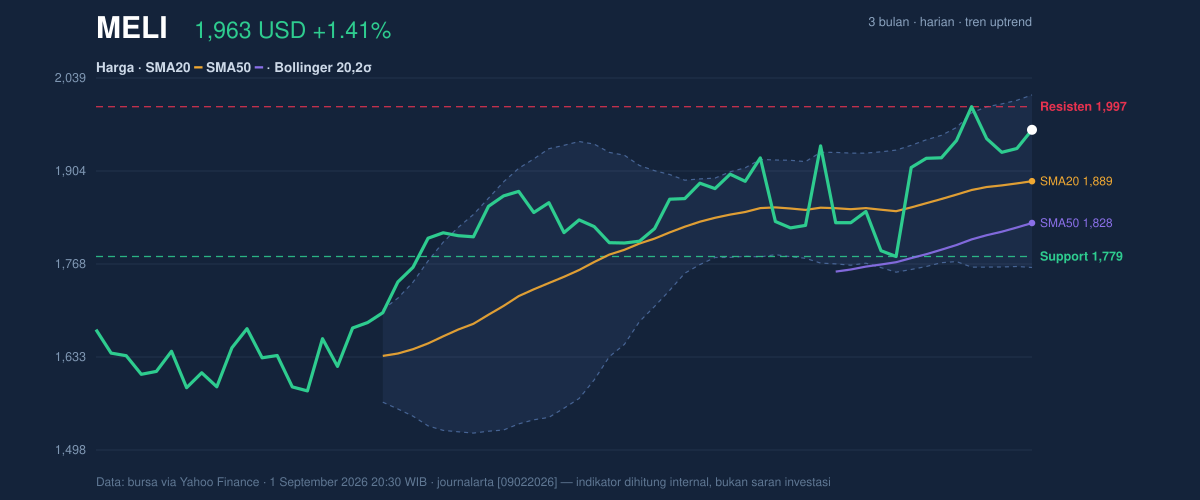
MercadoLibre is trading near the top of its recent range, and the message from the chart is straightforward: momentum is still constructive, but the stock is approaching a level where buyers have recently become less comfortable adding risk.
MercadoLibre’s shares closed at 1,963.49 USD on Nasdaq, up 1.41% on the day, with the stock also higher over 5 days and 1 month. That matters because the move is not just a one-session bounce: the price remains above the short- and medium-term trend markers, which signals that the broader market is still willing to pay up for the story. The stock is trading above SMA20 at 1,888.65 and well above SMA50 at 1,827.86, while the SMA20 slope is rising, a classic sign that recent strength is being reinforced rather than fading. As shown in the chart, the shares are also sitting in the upper part of the 20-day range, which tells readers the market has already absorbed a good deal of positive news.
That said, the position is getting extended.
The price is close to resistance, not far from the ceiling.
Trend & Price Action
The most important trend signal is that MercadoLibre remains in an uptrend with the price above SMA20 and SMA50. In technical terms, that usually means the market is in a “trend-following” phase, where dips are more often bought than sold. The absence of a new MA-cross is also useful: it suggests there has not been a fresh regime change, so the existing structure is still intact rather than being reset by a bearish crossover.
The stock is trading at about 85% of its 20-day range, which is a sign of strength but also of proximity to near-term resistance. The chart shows 20-day support at 1,779.14 and 20-day resistance at 1,997.00. In plain language, the market is near the upper boundary of where it has recently been willing to trade, so the next few sessions are more likely to test whether momentum can extend through that ceiling or stall beneath it.
Oscillators & Momentum
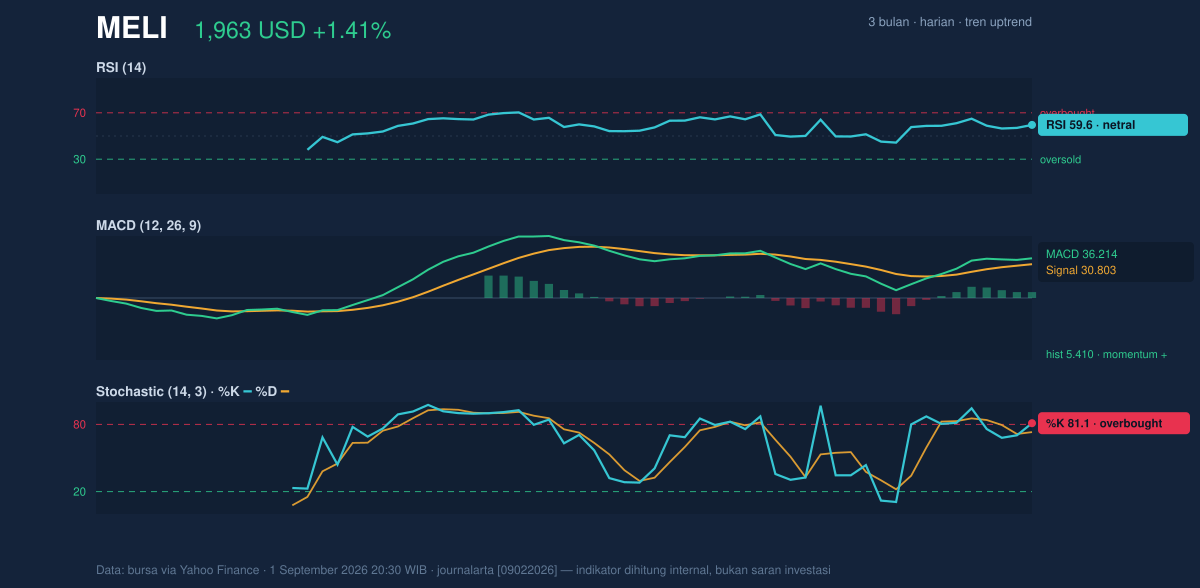
Momentum is mixed rather than uniformly strong. The RSI at 59.6 is still neutral, which means the stock is not yet in the classic overbought zone that often warns of exhaustion. But the Stochastic %K at 81.1 and %D at 73.1 are overbought, which usually signals that the share price has advanced quickly enough that short-term traders may start locking in gains. That does not automatically mean a reversal is near; it means the stock is more vulnerable to pauses or shallow pullbacks if fresh demand does not keep pace.
The more encouraging piece is the MACD at 36.214, still above its signal line at 30.803, with a positive histogram of 5.410. MACD is a trend-following momentum tool, so when it remains above signal and the histogram stays positive, it indicates that upside momentum is still outpacing downside pressure. In other words, the stock may be stretched in the short term, but the underlying trend is not yet breaking.
Volatility & Volume
Volatility is elevated. The ATR(14) at 68.99 equals about 3.5% of price, which means MercadoLibre can move sharply even without a major news catalyst. For readers, ATR is a measure of typical daily range; a higher reading usually means wider swings and less forgiving entry points. That matters here because the stock is trading close to resistance, where a volatile name can either break out quickly or reverse just as fast.
The Bollinger Bands add a similar message. Price is near the upper band at 2,014.19, with %B at 80% and a normal band width of 13.3%. That combination says the stock is leaning toward the upper end of its recent volatility envelope, but not in a dramatic squeeze or expansion regime. In practical terms, the market is not compressed and waiting for a big move; it is already moving, and the question is whether that move has enough fuel left.
Volume, however, is softer than the price action suggests. The latest reading of 325,300 shares is only 0.7x the 20-day average of 491,550. That means the advance has not been backed by unusually heavy participation. On the other hand, OBV is rising, which indicates that cumulative buying pressure has still been building over time even if the latest session was not especially active. The signal here is subtle: the trend is supported, but not yet fully confirmed by a surge in turnover.
Key Levels & Scenarios
The key technical map is clear. Immediate resistance sits at 1,997.00, with the upper Bollinger band just above at 2,014.19 and the 3-month high at 2,011.20. That cluster matters because it creates a tight zone where the stock has to prove it can transition from recent strength into fresh price discovery. On the downside, 1,888.65 is the first important trend marker, followed by 1,779.14 as the more meaningful support line. The 3-month low at 1,546.00 frames the broader range, but it is not the immediate battleground.
If price can hold above 1,888.65 and push through 1,997.00, the chart would suggest continuation of the current trend. If it fails to hold the 1,888.65 area, the market would be signaling that the recent advance is losing traction and may need a deeper reset toward 1,779.14. The important nuance is that the stock is not weakening yet; it is simply testing whether the current trend can keep climbing while momentum oscillators are already leaning hot.
Technical Verdict: HOLD (wait & see)
HOLD (wait & see)
- Why: the stock remains in an uptrend with price above SMA20 and SMA50, which supports the broader structure.
- Why: MACD is positive and above signal, so trend momentum is still intact.
- Why: Stochastic is overbought and price is near resistance at 1,997.00, while volume is only 0.7x average, limiting confirmation.
- Verdict invalidated if price breaks below 1,779.14, which would weaken the current support structure.
- Ideal entry range: 1,888.65 to 1,997.00
- Exit target: 1,997.00 to 2,014.19
- Stop loss protection: below 1,779.14
In plain English, the chart still looks healthy, but the stock is close enough to resistance that the next move needs confirmation rather than assumption.
As of 1 September 2026 20:30 WIB, MercadoLibre’s last price was 1,963.49 USD.
Summary Data MELI
| Last price | 1,963.49 USD |
| Change 1 day / 5 days / 1 month | 1.41% / 0.80% / 3.41% |
| Trend / MA-cross | uptrend / none |
| SMA20 / SMA50 | 1,888.65 / 1,827.86 |
| RSI (14) / Stochastic %K | 59.6 / 81.1 |
| Bollinger %B / ATR | 80% / 68.99 |
| Support / Resistance 20 days | 1,779.14 / 1,997.00 |
| Data as of | 1 September 2026 20:30 WIB |
Track MELI stock price daily: live levels, support/resistance and our full MELI analysis history.



