Momentum Gains, UNH Stock Gains 1.77% Today
On September 2, 2026: price 396.30 USD, trend downtrend, RSI 46.1, support 384.85, resistance 412.75. technical analysis of unh stock. Momentum Gains — full…
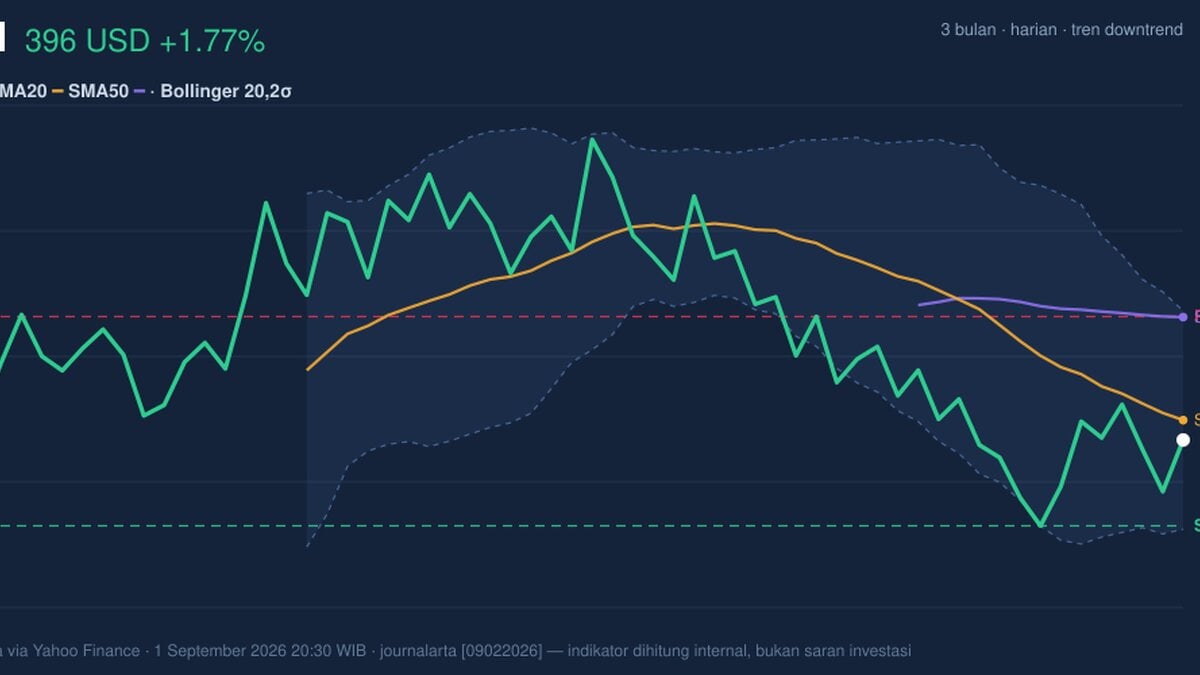
UnitedHealth Group shares rose in New York, with UNH last trading at $396.30 on the NYSE, up 1.77% from the previous close, but the move still leaves the stock below its short- and medium-term trend markers. The chart is telling a more cautious story than the day’s gain suggests.
Trend & Price Action
UNH is still in a downtrend, and that matters more than one positive session. The stock is trading below the 20-day moving average at $398.94 and well under the 50-day moving average at $412.67, which means recent price action has not yet reclaimed the levels that typically signal a more durable recovery. With the SMA20 slope at -1.51% over 5 days, the short-term trend is still pointing lower, even though the latest close nudged back toward the moving average.
The broader range also frames the move. UNH sits between the 3-month high of $461.62 and the 3-month low of $374.72, but it is closer to the lower end of that band than the upper end. As shown in the chart, price is currently at 41% of the recent range, which suggests the market has recovered from the lows but has not yet rebuilt enough strength to challenge resistance decisively.
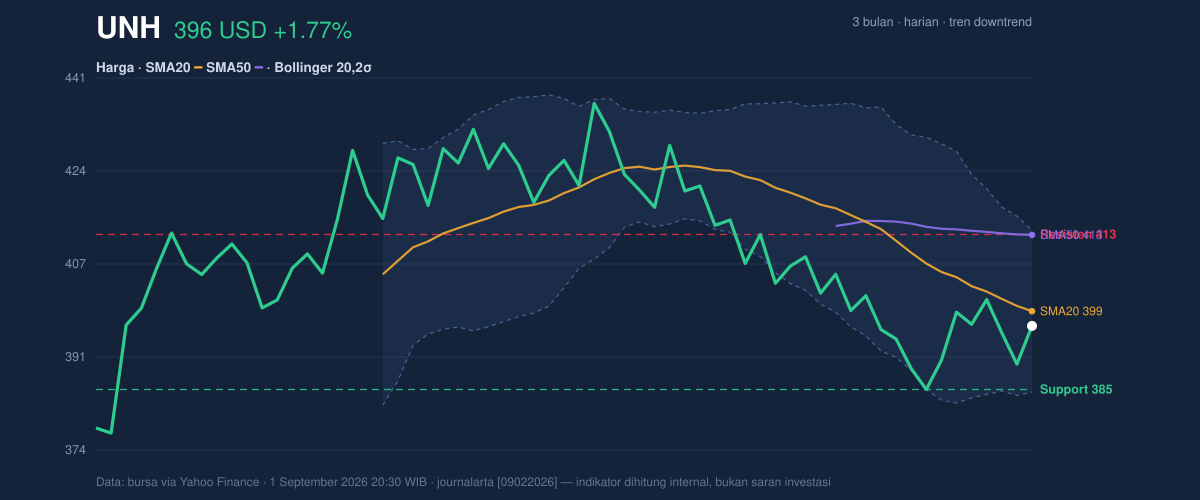
The most important near-term signal is that price is hovering just under the Bollinger middle band at $398.94. That middle band often acts like a reference line for trend direction: trading below it usually means sellers still have the upper hand, while a clean move above it can show that momentum is stabilizing.
Oscillators & Momentum
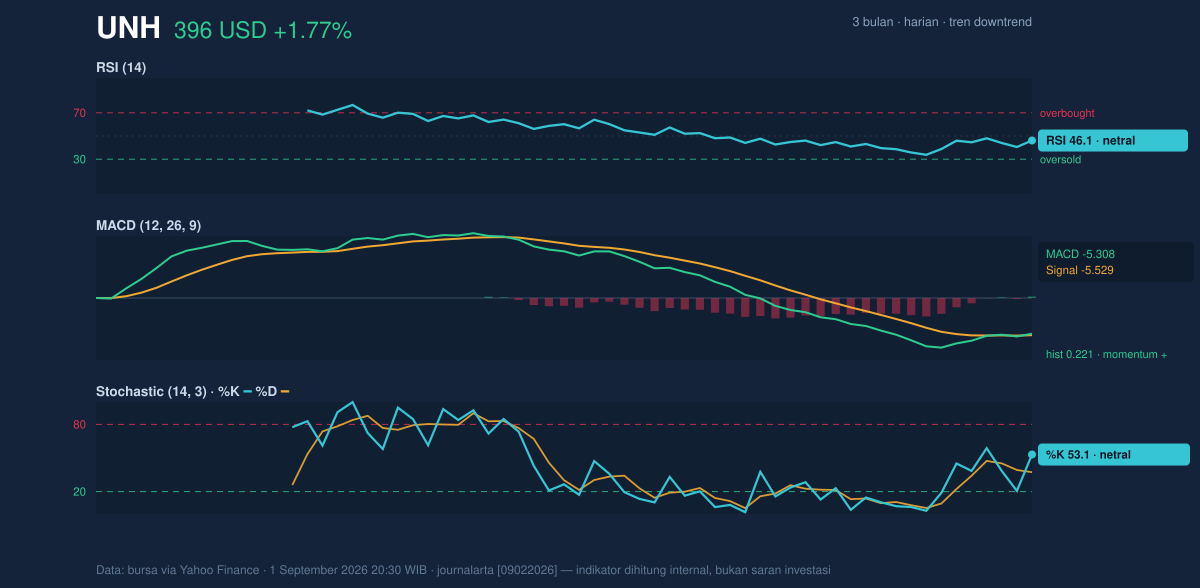
Momentum is mixed rather than clearly bearish. The RSI at 46.1 is neutral, which means UNH is neither oversold nor overbought; in plain English, the stock is not showing the kind of extreme condition that often precedes a sharp snapback or a fresh selloff. The Stochastic %K at 53.1 and %D at 37.4 also sit in neutral territory, but the gap between the two lines suggests short-term momentum has improved enough to keep the stock from looking technically washed out.
The most constructive part of the setup is the MACD at -5.308 versus the signal line at -5.529, with a positive histogram of 0.221. That combination means the stock is still below zero on the MACD scale, so the broader momentum trend is not fully repaired, but the histogram turning positive indicates the downside pressure is easing. In practical terms, sellers may still dominate the larger pattern, yet the pace of that selling has slowed.
That is why the chart does not read as a straight bearish continuation. It reads more like a market trying to stabilize after a decline, with momentum improving before price has fully confirmed it.
Volatility & Volume
Volatility is moderate, but the band structure is more important than the raw ATR reading. The ATR(14) at 8.12, or 2.0% of price, says daily movement is still meaningful without being unusually wild. More telling is the Bollinger Band width of 7.3%, which is squeezing. A squeeze usually means the stock has been trading in a narrower range and may be building pressure for a larger move. That does not predict direction by itself, but it does warn that the next decisive break could be sharper than the recent day-to-day drift.
The %B reading of 41% shows price is in the lower half of the Bollinger envelope, but not near the lower band at $384.40. That positioning matters: UNH is not under immediate technical stress, yet it is also not pressing into a bullish breakout zone.
Volume does not yet confirm the rebound. The latest volume of 3,716,200 was about 0.9x normal versus the 20-day average of 4,229,615, and OBV is down. OBV, or on-balance volume, tracks whether trading volume is flowing more into up days or down days. A falling OBV usually means rallies are not being strongly supported by accumulation, so the latest bounce still needs more participation to be trusted.
Key Levels & Scenarios
The chart’s immediate battleground is clear. Support at $384.85 is the first level that matters if the stock rolls over again, while resistance at $412.75 is the first ceiling that would need to be cleared to show real improvement. The price is currently sitting much closer to support than resistance, which keeps the setup balanced but not yet bullish.
If UNH can reclaim the $398.94 area and then push through $412.75, the chart would begin to shift from stabilization toward repair. That would also move the stock back above both the 20-day average and the middle Bollinger band, two levels that often act as the first proof that a downtrend is losing force.
If instead the shares fail to hold $384.85, the next message from the chart would be that the recent bounce was just a pause inside the downtrend, not a reversal. The 3-month low of $374.72 would then become the next reference point.
Technical Verdict: HOLD (wait & see)
HOLD (wait & see) fits best because the chart shows a stock that is still in a downtrend, but with momentum that is no longer fully deteriorating. The price remains below the SMA20 and SMA50, the OBV is down, and volume is still light, which argues against treating the bounce as confirmed strength. At the same time, the MACD histogram is positive, the RSI is neutral, and the Bollinger Bands are squeezing, which suggests the market may be preparing for a larger move rather than simply continuing lower in a straight line.
- Ideal Entry Range: $384.85 to $398.94
- Exit Target: $412.75
- Stop Loss protection: below $384.40, with the lower reference at $374.72
- Verdict invalidated if price breaks below $384.85
In plain English: the stock is trying to steady itself, but it has not yet proven that the decline is over.
UnitedHealth’s next technical test is whether it can reclaim $398.94 and then challenge $412.75.
Summary Data UNH
| Last price | 396.30 USD |
| Change 1 day / 5 days / 1 month | 1.77% / -0.62% / -4.59% |
| Trend / MA-cross | downtrend / none |
| SMA20 / SMA50 | 398.94 / 412.67 |
| RSI (14) / Stochastic %K | 46.1 / 53.1 |
| Bollinger %B / ATR | 41% / 8.12 |
| Support / Resistance 20 days | 384.85 / 412.75 |
| Data as of | 1 September 2026 20:30 WIB |
Track UNH stock price daily: live levels, support/resistance and our full UNH analysis history.



