Momentum Weakens, BP Stock Gains 5.21% Today
On September 2, 2026: price 541.30 GBp, trend sideways, RSI 55.8, support 514.50, resistance 552.20. technical analysis of bp stock. Momentum Weakens — full…
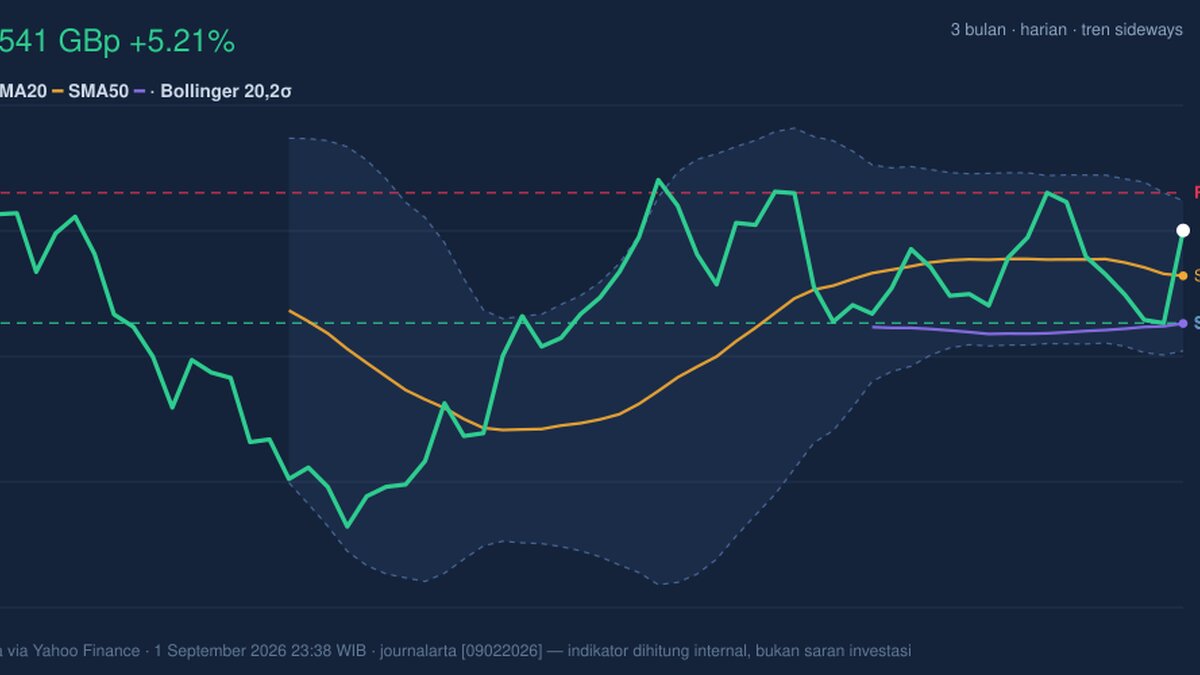
BP plc (LSE: BP) ended at 541.30 GBp, up 5.21% on the day from a 514.50 previous close, according to data from Yahoo Finance via the London Stock Exchange. That move lifts the shares back above SMA20 at 528.18 and above SMA50 at 514.40, which matters because it shows the price has reclaimed both short- and medium-term averages. But the broader message from the indicators is less clean: the stock is still in a sideways trend, the momentum gauges are mixed, and volume is not confirming the advance.
Trend & Price Action
The first signal is structural. BP is trading above SMA20 and above SMA50, which usually tells traders that recent selling pressure has eased and the share price is no longer sitting below its near-term trend lines. Yet the trend description remains sideways, and the SMA20 slope is -0.88% over 5 days. That combination is important: price can bounce above moving averages without yet establishing a durable uptrend if the average itself is still flattening or drifting lower.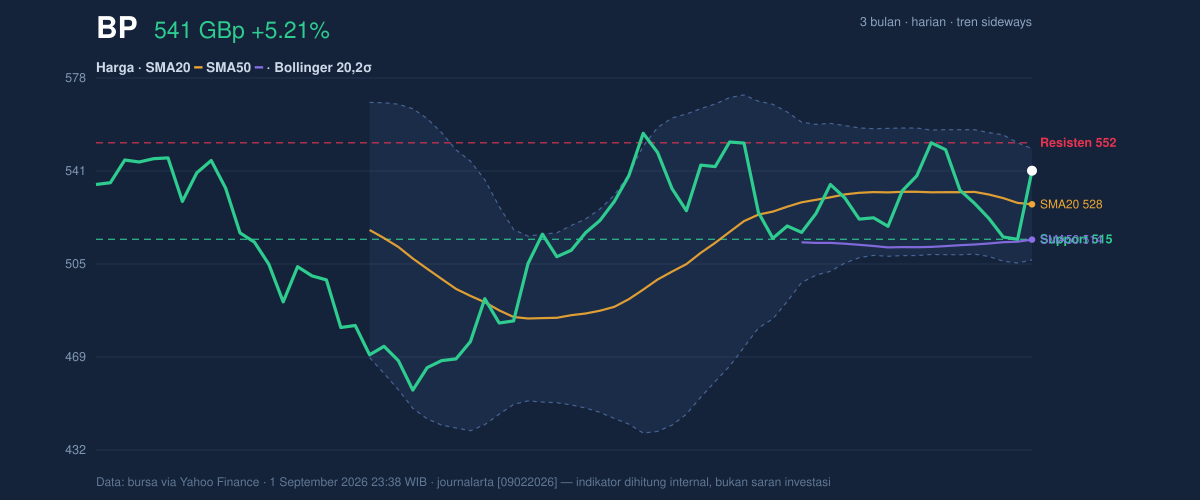
Oscillators & Momentum
The momentum picture is where the rally starts to look less convincing. The RSI at 55.8 is neutral-to-firm, which says the stock is not overbought on a broader momentum basis. But the Stochastic %K at 97.4 versus %D at 35.5 is a much hotter reading. In plain English, that means the latest price action has moved quickly toward the top of its recent range, often a sign of short-term enthusiasm that can fade if it is not followed by stronger buying.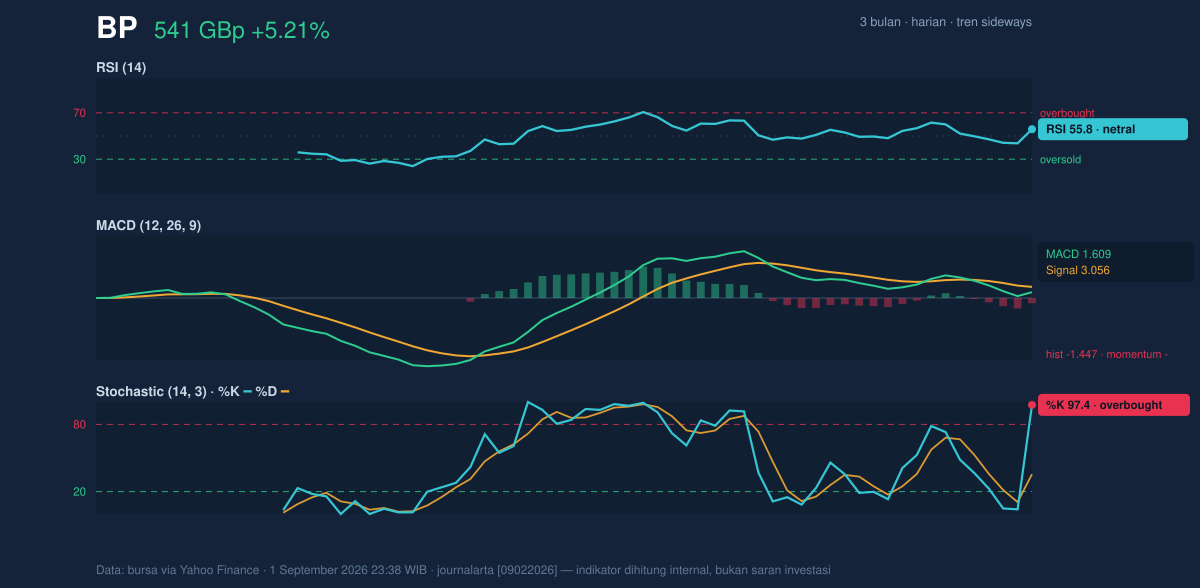
Volatility & Volume
Volatility is elevated. The ATR at 48.10 equals 8.9% of price, which means BP can move sharply even over short periods. That matters because a stock with a narrow daily gain can still be vulnerable to fast retracements if momentum weakens. The Bollinger band width of 8.2% is described as normal, so this is not a squeeze that usually precedes a dramatic breakout; instead, it suggests the market is trading in a fairly standard range with enough volatility to produce false starts. The volume story is weak. Last volume was 3,183 against a 20-hour average of 49,023,582, and OBV is falling. That is a poor confirmation signal. A strong breakout normally needs broad participation, but here the price rise is happening with very light trading and declining on-balance volume, which implies that the move may not yet have attracted committed buyers. For chart readers, that is the difference between a rally that is being validated and one that is simply being tested.Key Levels & Scenarios
The immediate map is straightforward. 514.50 is the nearest support and also the day’s reference point, while 528.18 marks the SMA20 zone that the shares have reclaimed. Above, 549.90 is the upper Bollinger band and 552.20 is the next resistance level. If BP can hold above 528.18 and then clear 549.90-552.20 with better participation, the chart would begin to look less like a bounce and more like a trend extension. If it fails to hold 514.50, the recent rebound loses credibility quickly, especially given the negative MACD histogram and falling OBV. The broader context is also telling. BP’s 3-month high is 562.90, so the stock is not far from the upper end of that recent range, but it is still below that peak. That leaves the shares in a zone where upside progress is possible, yet still dependent on confirmation rather than assumption.Technical Verdict: HOLD (wait & see)
The setup is improved, but not confirmed. - Price above SMA20 and SMA50 supports the bounce and shows the shares have recovered key trend markers. - RSI is neutral, but Stochastic is overbought and MACD remains negative, which argues for caution after the one-day jump. - Volume is extremely weak and OBV is falling, so the move lacks participation. Verdict invalidated if price falls below 514.50. - Ideal Entry Range: 514.50 to 528.18 - Exit Target: 549.90 to 552.20 - Stop Loss protection: below 514.50 For non-traders, this means BP has bounced, but the chart still needs stronger proof before the move can be treated as durable. The next test is whether BP can hold 514.50 and challenge 552.20 in the next session.Summary Data BP
| Last price | 541.30 GBp |
| Change 1 day / 5 days / 1 month | 5.21% / 1.42% / -1.96% |
| Trend / MA-cross | sideways / none |
| SMA20 / SMA50 | 528.18 / 514.40 |
| RSI (14) / Stochastic %K | 55.8 / 97.4 |
| Bollinger %B / ATR | 80% / 48.10 |
| Support / Resistance 20 days | 514.50 / 552.20 |
| Data as of | 1 September 2026 23:38 WIB |
Track BP share price daily: live levels, support/resistance and our full BP analysis history.



