MRK Stock Technicals Today: Gains 1.42%, Momentum Gains
On September 2, 2026: price 149.86 USD, trend uptrend, RSI 63.7, support 128.00, resistance 156.45. technical analysis of mrk stock. MRK Stock Technicals —…
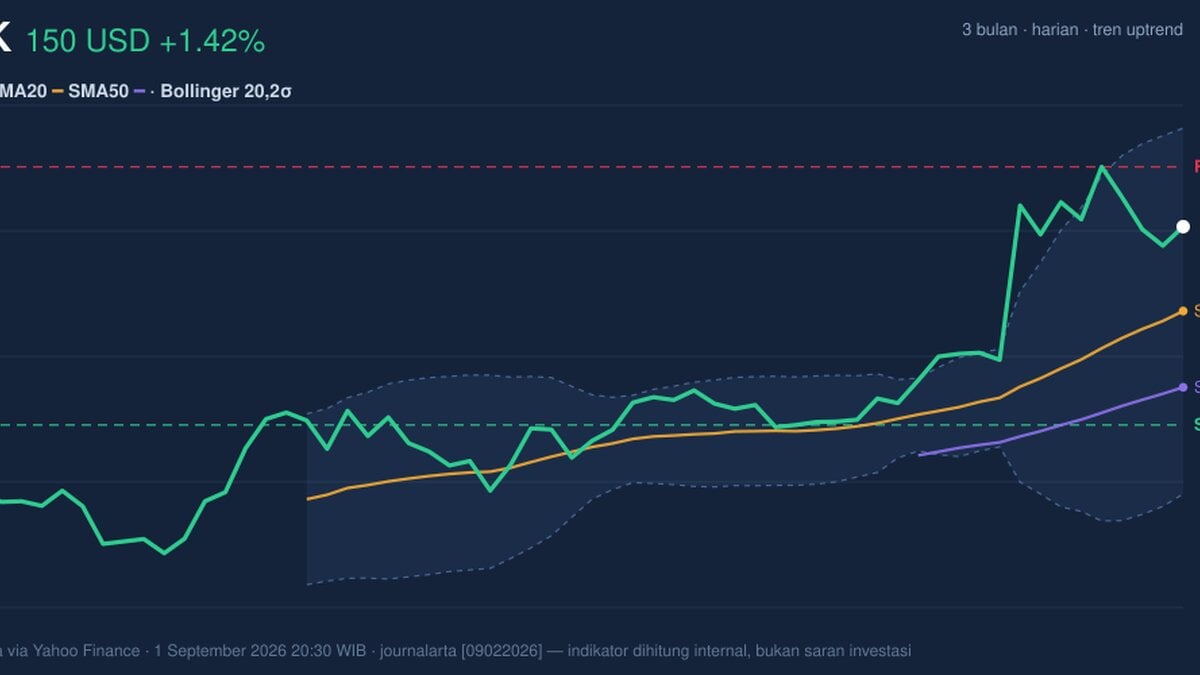
Merck is trading higher into the upper part of its recent range, but the message from the chart is less about a breakout than about a stock that has already done a lot of the heavy lifting. The shares closed at 149.86 USD, up 1.42% on the day and 17.29% over the past month, according to data from Yahoo Finance via the exchange feed. That puts Merck well above its short- and medium-term trend lines, yet still below the recent ceiling near the mid-150s, where the market has already started to test patience.
Trend & Price Action
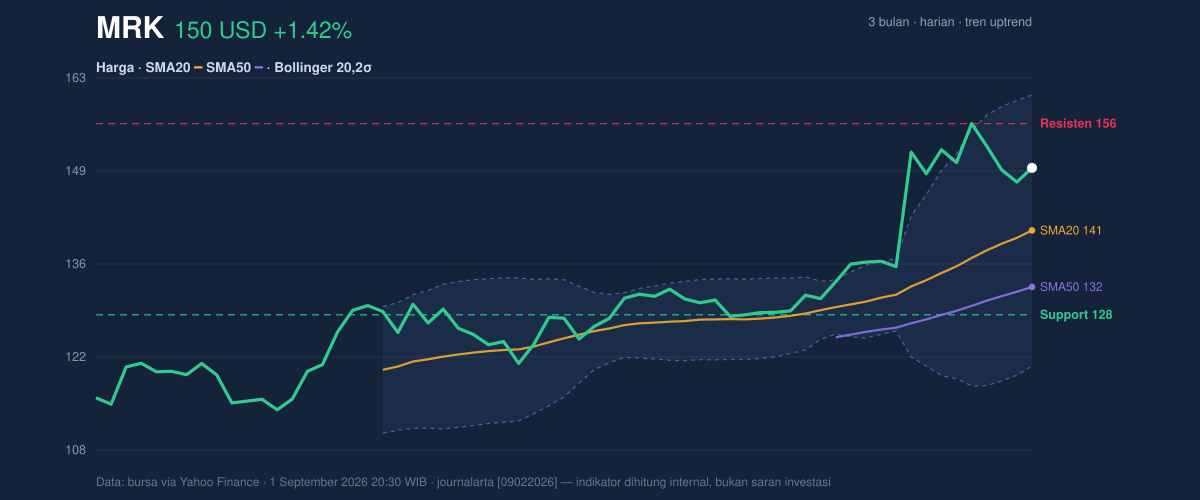
The first thing that stands out is structure. Merck is in an uptrend, with the SMA20 at 140.56 sitting above the SMA50 at 132.16, a classic sign that the shorter trend is stronger than the longer one. The stock is also trading above the SMA20, which matters because it shows buyers have not only pushed price higher, they have kept it there. The slope of the SMA20, at 3.95% over 5 days, signals that the trend is still rising rather than flattening out.
But the chart also shows a stock that is no longer cheap in technical terms. Price is at 77% of its 20-hour range, which means it is closer to resistance than support. The recent 3-month high of 156.92 sits just above the current 20-hour resistance at 156.45, while the 3-month low of 111.57 is far below and mostly relevant as a reminder of how much the stock has already recovered. In other words, the trend is constructive, but the easy part of the move may already be behind it.
The key signal here is not just that Merck is rising, but that it is rising from a stronger base than it had a month ago.
Oscillators & Momentum
The momentum picture is supportive, though not euphoric. The RSI at 63.7 is described as neutral, which is important because it shows the stock is not yet in the overbought zone where rallies often start to lose urgency. The Stochastic %K at 74.8 and %D at 72.1 also sit in neutral territory, but near the upper end of the scale. That usually means the stock has momentum, yet it is no longer in the early stages of the move. Traders watching this setup will read that as a market that can still advance, but may need fresh news or strong participation to extend gains cleanly.
The most encouraging oscillator is the MACD at 6.225, above its signal line at 5.685, with a positive histogram of 0.539. In plain English, MACD is a trend-following gauge; when it stays above its signal line, it suggests upward momentum is still in place. The positive histogram means that momentum is not only positive, but still slightly accelerating.
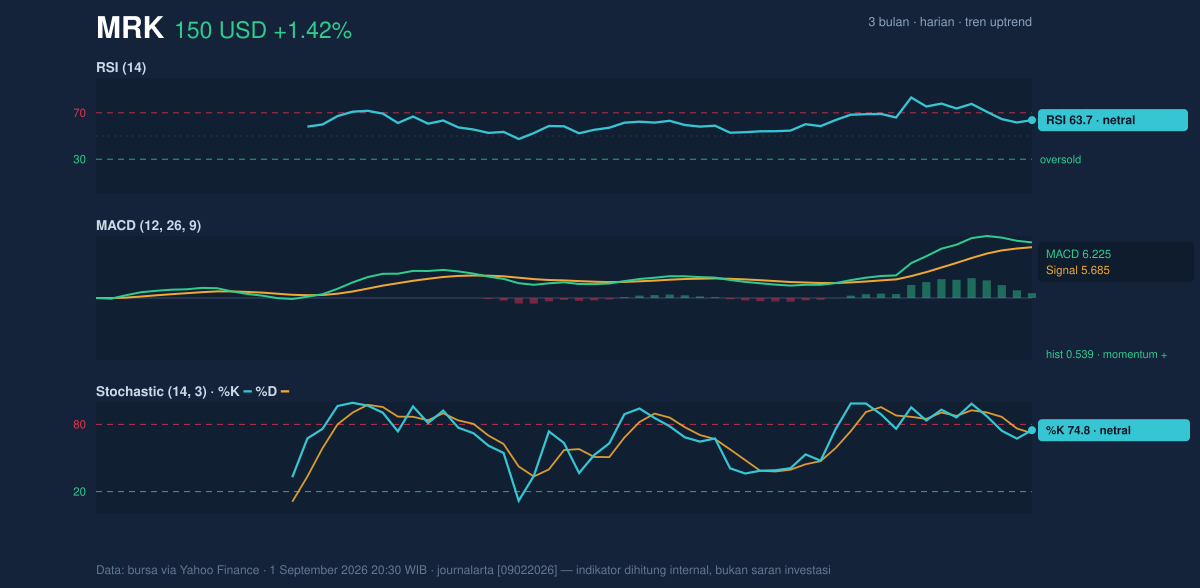
That said, the oscillators are aligned more with continuation than with overheating.
Volatility & Volume
Bollinger Bands add an important layer to the story. Merck is trading with a %B of 73%, meaning the price is sitting in the upper portion of the band structure, but not pressing the top band at 160.72. The band width has expanded to 28.7%, which points to higher volatility. Expanded bands often follow a strong move and tell readers to expect wider daily swings rather than a smooth climb. That matters because a strong chart can still produce sharp pullbacks when volatility is elevated.
ATR, or average true range, is 4.97, equal to 3.3% of price. That is a useful reminder that a normal day can still be a fairly large move in dollar terms. The latest volume of 9,865,600 was below the 20-day average of 11,308,770, or 0.9× normal, which means the latest advance did not come with full participation. Yet OBV is rising, and that is a subtle but important confirmation: on balance, money has been flowing into the stock even if the most recent session was not a volume surge.
For readers, that combination says the trend is real, but not fully sponsored by a broad wave of trading yet.
Key Levels & Scenarios
The market is now boxed between a well-defined floor and a nearby ceiling. The main support is 128.00, while the main resistance is 156.45. Because the stock is already trading close to the upper half of the range, the next test is whether it can challenge the resistance zone without momentum fading. If price clears and holds above 156.45, the chart would be probing the 156.92 3-month high area, where traders often look for confirmation that the move is extending rather than simply revisiting prior highs.
If Merck slips back, the first question is whether it can stay above the rising trend base around the SMA20 at 140.56. A break below that area would not automatically end the uptrend, but it would suggest the market is losing pace and that recent gains are being digested. Below that, the 128.00 support becomes the critical line that separates a normal pullback from a more serious technical reset.
Technical Verdict: HOLD (wait & see)
HOLD (wait & see)
- The trend is positive, with price above the SMA20 and the SMA20 above the SMA50, which keeps the broader setup constructive.
- MACD is positive and OBV is rising, so momentum and underlying participation still favor the upside.
- But %B at 73%, price near the upper part of the range, and volume below average suggest the move is extended enough to warrant patience rather than urgency.
Verdict invalidated if price falls below 128.00, because that would break the key support zone and weaken the current trend structure.
- Ideal Entry Range: 140.56 to 149.86
- Exit Target: 156.45 to 156.92
- Stop Loss protection: 128.00
In plain English: Merck still looks healthy, but the chart is asking for confirmation before it proves the next leg higher.
Summary Data MRK
| Last price | 149.86 USD |
| Change 1 day / 5 days / 1 month | 1.42% / -0.53% / 17.29% |
| Trend / MA-cross | uptrend / none |
| SMA20 / SMA50 | 140.56 / 132.16 |
| RSI (14) / Stochastic %K | 63.7 / 74.8 |
| Bollinger %B / ATR | 73% / 4.97 |
| Support / Resistance 20 days | 128.00 / 156.45 |
| Data as of | 1 September 2026 20:30 WIB |
Track MRK stock price daily: live levels, support/resistance and our full MRK analysis history.