OCBC Stock Technicals Today: Gains 0.87%, Testing Key Resistance
On September 2, 2026: price 31.34 SGD, trend uptrend, RSI 65.2, support 28.63, resistance 31.79. technical analysis of ocbc stock. OCBC Stock Technicals — full…
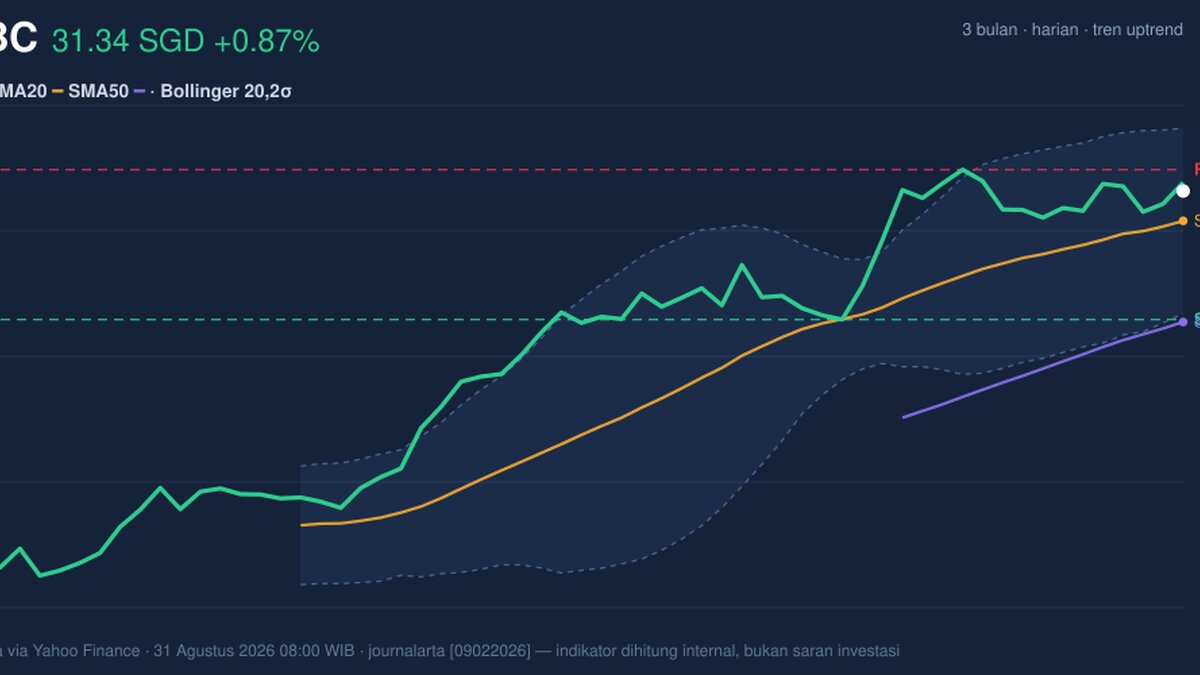
OCBC Bank’s shares on SGX edged higher to SGD 31.34, up 0.87% on the day and 7.59% over the past month, according to Yahoo Finance data cited for 31 August 2026 08:00 WIB. The move keeps the counter firmly in an uptrend, but the chart shows a more nuanced picture: price is still advancing above its moving averages, yet the momentum gauges are no longer fully aligned, which often means the market is climbing, but with less force than before.
Trend & Price Action
The most important signal is that OCBC remains above both its SMA20 at SGD 30.71 and SMA50 at SGD 28.58. That matters because it tells traders the share is still trading in a constructive structure, with short-term price action sitting above the medium-term baseline and the longer trend line below that. The SMA20 slope of 1.69% over 5 days reinforces that the recent direction is still upward, even though there has been no fresh moving-average crossover to add a new burst of trend confirmation.
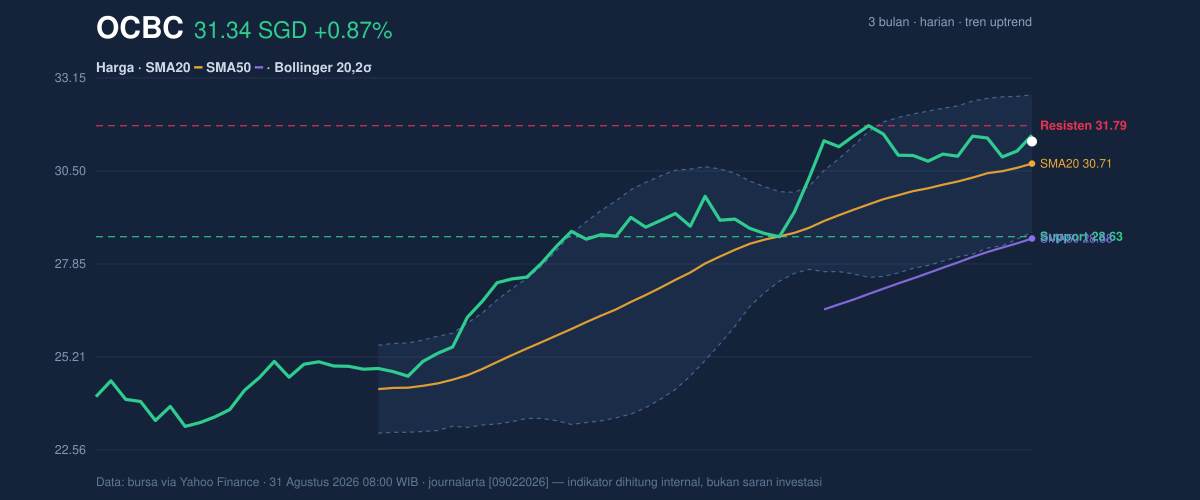
The current price is also positioned near the upper part of its recent band. With support at SGD 28.63 and resistance at SGD 31.79, the stock is trading at about 86% of the range, which signals strength, but also less room before it meets overhead supply. In plain terms, OCBC is not in a weak position; it is in the upper half of the corridor, where gains can continue, but where the market often pauses to test whether buyers still have enough conviction to push through resistance. The 3-month high of SGD 31.86 is especially relevant because the share is approaching that ceiling, and that level may now act as the real test of whether this advance can extend or simply consolidate.
Oscillators & Momentum
Momentum indicators are sending a more cautious message than the trend indicators. The RSI at 65.2 is still described as neutral, but it is close enough to the upper zone to show that the stock is no longer early in its advance. Meanwhile, the Stochastic %K at 79.4 and %D at 63.8 suggest the share is near the upper end of its recent trading rhythm, which often means the market is stretched rather than exhausted. That is not a reversal signal on its own, but it does imply that upside may become harder to sustain without fresh buying interest.
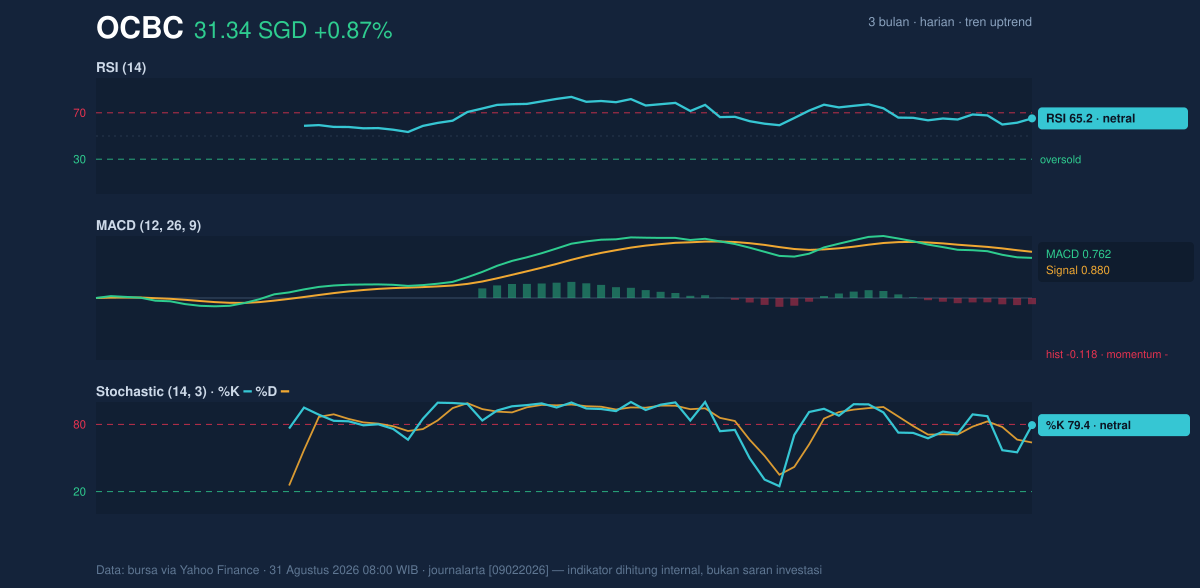
The clearest caution comes from the MACD at 0.762, which sits below its signal line at 0.880, leaving a negative histogram of -0.118. For readers unfamiliar with the term, MACD is a trend-following momentum gauge; when it turns negative while price is still rising, it often means the rally is losing some internal energy even if the chart has not broken down yet. That is the key divergence here: price is still firm, but momentum has started to lag. In practical terms, this often leads to either a brief pause, a sideways consolidation, or a more selective advance rather than a straight continuation.
Volatility & Volume
Volatility is moderate rather than extreme. The ATR(14) of 0.56, equal to 1.8% of price, suggests daily swings are present but not disorderly. That usually supports a market that can trend without wild gaps, but it also means any move through resistance may need a clear catalyst rather than just routine trading flow. The Bollinger Bands add another layer: with the upper band at SGD 32.67, the middle band at SGD 30.71, and the lower band at SGD 28.76, price is now above the midline and leaning toward the upper half of the envelope. The %B reading of 66% shows the share is above the centre of its recent volatility range, while the 12.7% band width indicates a normal, not compressed, setup. That is important because a squeeze would hint at an imminent sharp move; here, the market looks more like it is already in motion and now deciding whether it has enough strength to continue.
Volume is providing partial confirmation, but not complete conviction. Last trade volume of 10,101,900 was about 1.5 times the 20-hour average of 6,807,134, which means participation improved on the latest session. That is constructive, because rising price with heavier turnover usually shows buyers are willing to engage. Yet the OBV is down, and that matters: OBV, or on-balance volume, tracks whether volume is accumulating behind the move. A falling OBV while price rises can indicate that the latest lift is not being broadly supported over time, which makes the rally less robust than the headline price suggests.
Key Levels & Scenarios
The near-term structure is straightforward. SGD 31.79 is the immediate resistance to watch, with the 3-month high at SGD 31.86 just above it, and the upper Bollinger band at SGD 32.67 marking the next volatility boundary if the stock clears that zone. On the downside, SGD 30.71 is the first important reference because it is both the SMA20 and the Bollinger midline, while SGD 28.76 and SGD 28.63 form the lower technical floor from the band and range support.
If price holds above SGD 30.71 and can reclaim momentum, the chart would remain in a healthy consolidation within an uptrend. If it fails to hold that area, the market may be signalling that the recent advance has run ahead of itself. A break below SGD 28.63 would be more serious because it would take out the range support and put the lower Bollinger band at risk, which would weaken the current bullish structure.
Technical Verdict: HOLD (wait & see)
HOLD (wait & see)
- Trend remains positive: price is above the SMA20 at SGD 30.71 and SMA50 at SGD 28.58, and the SMA20 slope is rising.
- Momentum is mixed: RSI 65.2 and Stochastic 79.4/63.8 are supportive but stretched, while MACD is below signal with a -0.118 histogram.
- Participation is not fully confirmed: volume is 1.5× normal, but OBV is down, which tempers confidence in the advance.
- Verdict invalidated if price breaks below SGD 28.63, as that would damage range support and weaken the uptrend structure.
- Ideal Entry Range: SGD 30.71 to SGD 31.34
- Exit Target: SGD 31.79 to SGD 31.86
- Stop Loss protection: below SGD 28.63
In plain English, OCBC is still trending up, but the chart is asking for proof that buyers can keep pushing before the next leg becomes convincing.
Summary Data OCBC
| Last price | 31.34 SGD |
| Change 1 day / 5 days / 1 month | 0.87% / 1.36% / 7.59% |
| Trend / MA-cross | uptrend / none |
| SMA20 / SMA50 | 30.71 / 28.58 |
| RSI (14) / Stochastic %K | 65.2 / 79.4 |
| Bollinger %B / ATR | 66% / 0.56 |
| Support / Resistance 20 days | 28.63 / 31.79 |
| Data as of | 31 Agustus 2026 08:00 WIB |
Track OCBC share price daily: live levels, support/resistance and our full OCBC analysis history.



