Shell Testing Key Resistance: Stock Gains 2.63% (September 2, 2026)
On September 2, 2026: price 3,432.50 GBp, trend sideways, RSI 60.6, support 3,277.50, resistance 3,440.00. technical analysis of shell stock.
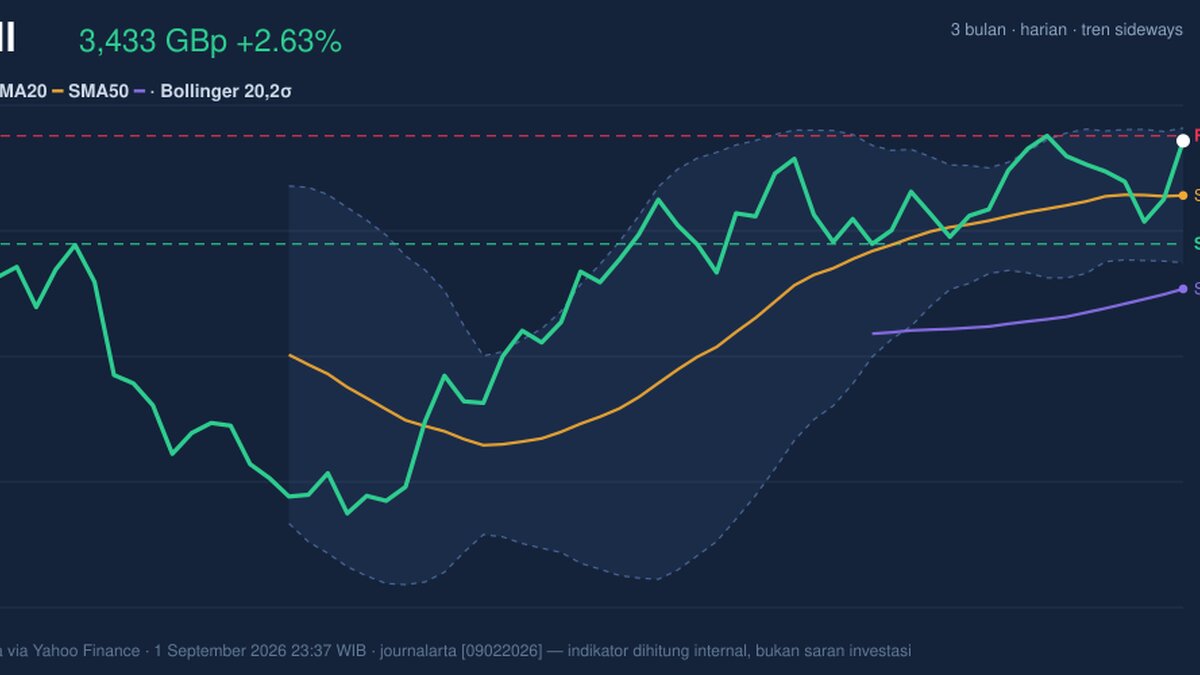
Shell plc’s shares on the London Stock Exchange rose to 3,432.50 GBp on 1 September, lifting the stock above its short-term average but leaving it just under the top of its recent trading band, according to Yahoo Finance data. The move looks constructive at first glance, yet the tape is sending mixed signals: price is pressing toward resistance, momentum is stretched, and participation remains thin, which means the advance has not been convincingly validated by volume.
Trend & Price Action
The broad read on Shell is still sideways, not trending decisively in either direction, even though the price sits above the SMA20 at 3,350.45 and well above the SMA50 at 3,210.05. That positioning matters because it shows the stock has repaired the weaker part of its chart and is now trading in the upper half of its recent range, but it does not yet prove a fresh uptrend. The SMA20 slope is only 0.27% over 5 days, which suggests gentle upward drift rather than strong directional momentum.
What makes the setup more interesting is how close Shell is to the upper Bollinger band at 3,451.62 and to the 20-hour resistance at 3,440.00. As shown in the chart, price is sitting at roughly 95% of the recent range, so the market is already leaning into the ceiling. That can be bullish if follow-through appears, but it also means the stock is vulnerable to rejection if buyers hesitate.
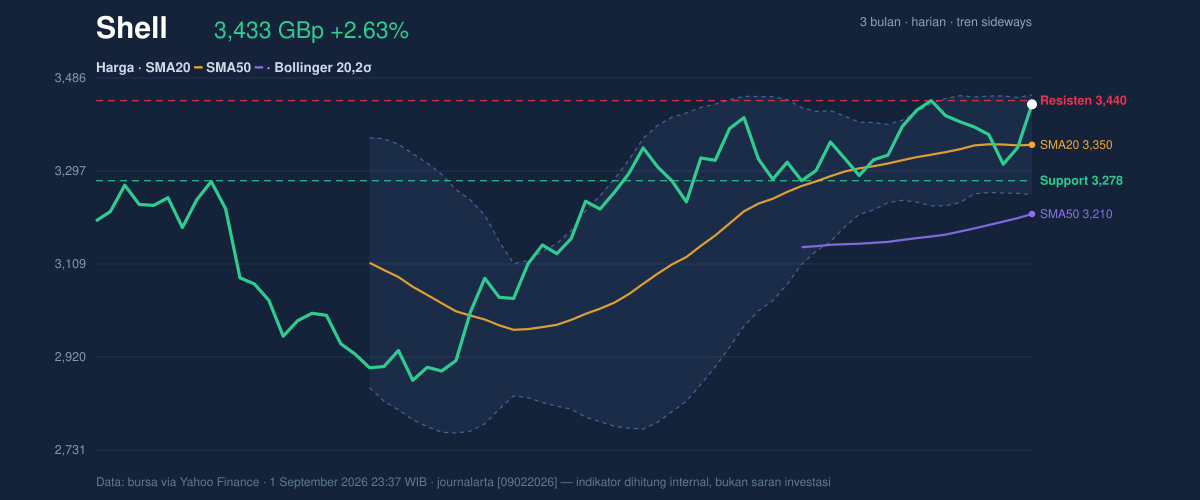
The Bollinger structure is also telling a subtler story. The band width is only 6.0%, described as a squeeze, which usually means the market has been compressing and is preparing for a larger move. In plain terms, a squeeze does not tell you direction; it tells you pressure is building. If Shell can clear the overhead band and resistance, the compression could release into a stronger leg higher. If it fails there, the same compression can unwind downward just as quickly.
Oscillators & Momentum
The momentum picture is less supportive than the price action. The RSI at 60.6 is still neutral, so it is not yet flashing a classic overbought warning on its own. But the Stochastic %K at 99.2 versus %D at 57.3 is a much hotter signal: that gap usually means the stock has moved very quickly and is now stretched near the top of its recent range. In practical terms, it often shows enthusiasm has outrun balance.
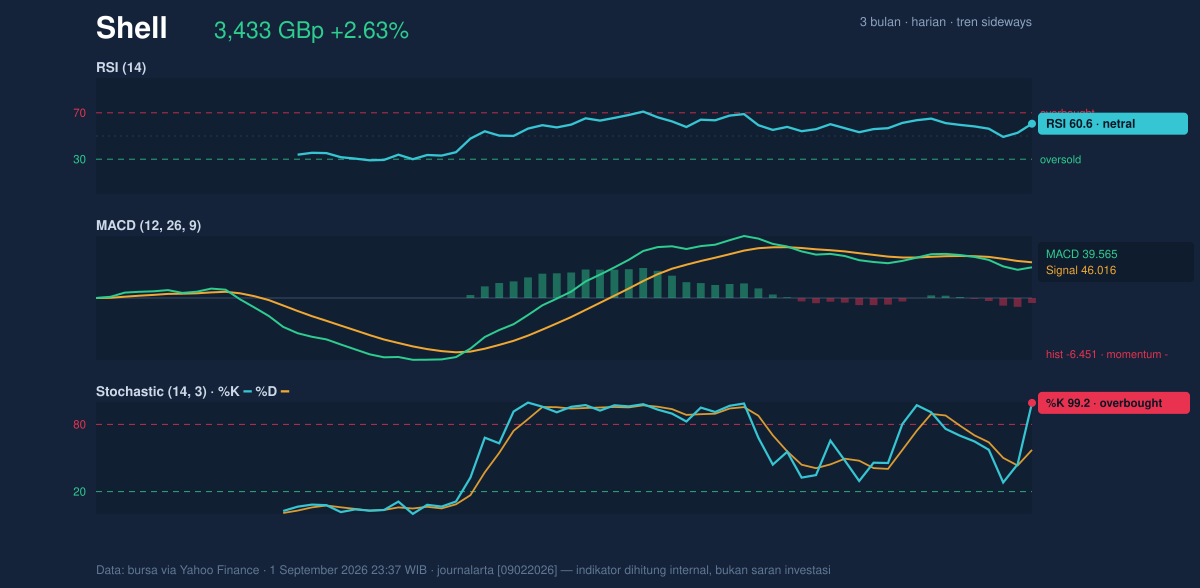
The MACD at 39.565 remains below its signal line at 46.016, and the histogram at -6.451 confirms momentum is still negative underneath the surface. That matters because MACD is a trend-following gauge: when it sits below signal, price can still rise, but the move is not yet fully confirmed. Put together, the oscillators are warning that the current push is vulnerable to fatigue even though the chart has not rolled over.
Volatility & Volume
Shell’s ATR(14) of 286.57, equal to 8.3% of price, points to high day-to-day volatility. That means the stock can move meaningfully without changing the larger trend, and it also means stops or invalidation levels need room. High ATR often appears when a market is deciding whether to break out or reverse, so the next move may be wider than recent trading suggests.
Volume is the weakest part of the setup. The last print of 5,420 against a 20-hour average of 8,665,230 is effectively quiet, and OBV is falling, which means the cumulative volume trend is not confirming the price rise. That divergence matters: a rally built on light participation can still continue, but it is more fragile than one backed by expanding turnover. In other words, the price is climbing, but the crowd is not clearly joining in.
Key Levels & Scenarios
The immediate line in the sand is support at 3,277.50, with the first hurdle at resistance at 3,440.00 and the Bollinger ceiling at 3,451.62. The stock is currently positioned between those two forces, close enough to resistance that the market is effectively testing whether recent buying has enough force to extend.
If Shell clears 3,440.00 and then pushes through 3,451.62, the squeeze setup would favor a stronger expansion move. If it fails to hold above the upper band and slips back under the SMA20 at 3,350.45, that would suggest the move was more of a probe than a breakout. A break below 3,277.50 would be more serious, because it would take price back toward the lower part of the recent range and undermine the current constructive bias.
Technical Verdict: HOLD (wait & see)
HOLD (wait & see) — the chart is constructive, but not confirmed.
- Price is above the SMA20 and SMA50, which is a positive structural sign.
- MACD is negative and OBV is falling, so momentum and participation are not fully supporting the rise.
- Stochastic is overbought while price sits near resistance at 3,440.00 and the upper Bollinger band at 3,451.62, raising the chance of near-term hesitation.
- Invalidation condition: this verdict is invalidated if price falls below 3,277.50.
- Ideal Entry Range: 3,350.45 to 3,440.00
- Exit Target: 3,451.62
- Stop Loss protection: 3,277.50
For non-traders, this means Shell looks steady but not yet proven enough to call a clean breakout.
“The stock is leaning upward, but it still needs the volume to prove the move is real.”
Summary Data Shell
| Last price | 3,432.50 GBp |
| Change 1 day / 5 days / 1 month | 2.63% / 1.05% / 0.79% |
| Trend / MA-cross | sideways / none |
| SMA20 / SMA50 | 3,350.45 / 3,210.05 |
| RSI (14) / Stochastic %K | 60.6 / 99.2 |
| Bollinger %B / ATR | 91% / 286.57 |
| Support / Resistance 20 days | 3,277.50 / 3,440.00 |
| Data as of | 1 September 2026 23:37 WIB |
Track Shell share price daily: live levels, support/resistance and our full Shell analysis history.



