Singtel Death Cross Pressure: Stock Drops 1.33% (September 2, 2026)
On September 2, 2026: price 4.46 SGD, trend sideways, RSI 60.9, support 4.25, resistance 4.54. technical analysis of singtel stock. Singtel Death Cross…
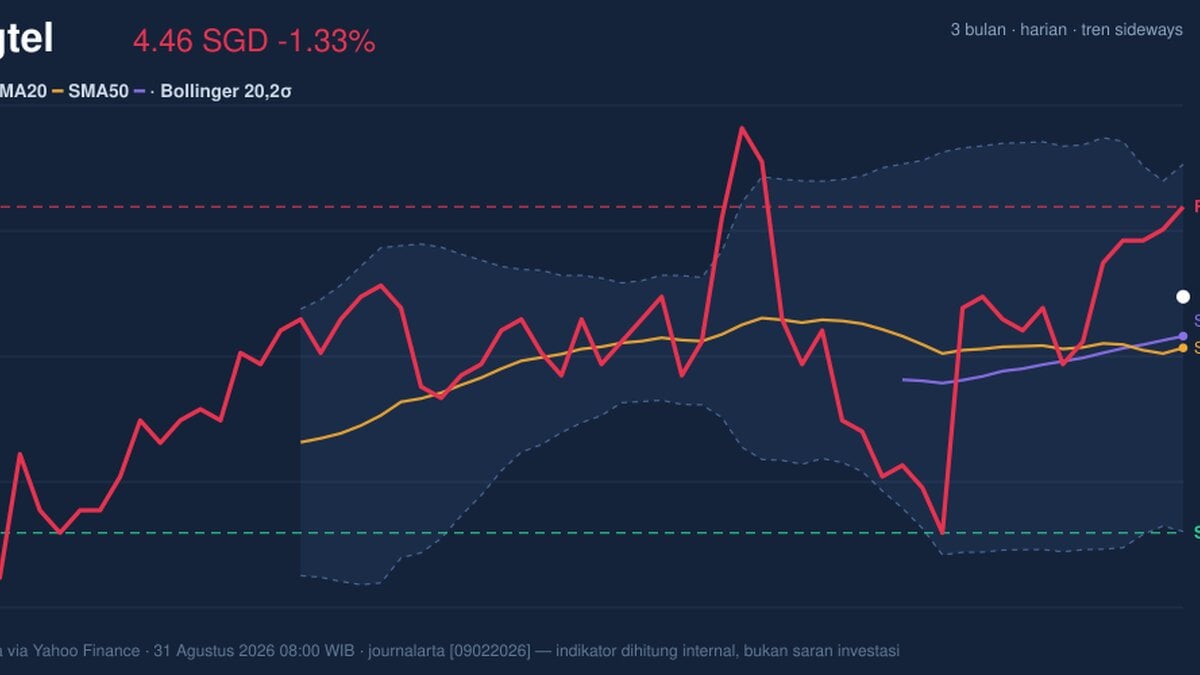
Singapore Telecommunications Ltd (Singtel) slipped to SGD 4.46 on SGX as of 31 August 2026, down from a previous close of 4.52, even as the shares still sit above their short-term moving average and near the upper half of the recent trading band. The move matters because it shows a market that is not in freefall, but is also not yet decisive: price is holding above SMA20 at 4.41 while the broader trend remains sideways, with the short average still drifting slightly lower and the chart showing a death cross between the 20-day and 50-day averages. That combination usually tells traders the stock has lost some intermediate momentum, even if buyers have not fully stepped aside.
Trend & Price Action
The headline signal is mixed, and that is the point. Singtel is trading above SMA20 but only just, while SMA50 at 4.42 sits almost level with it; that near-overlap suggests the stock is trying to stabilise rather than break into a clean directional run. The death cross is a caution flag because it means the shorter trend has slipped beneath the longer one, often a sign that rallies may meet selling pressure before they turn into sustained advances.
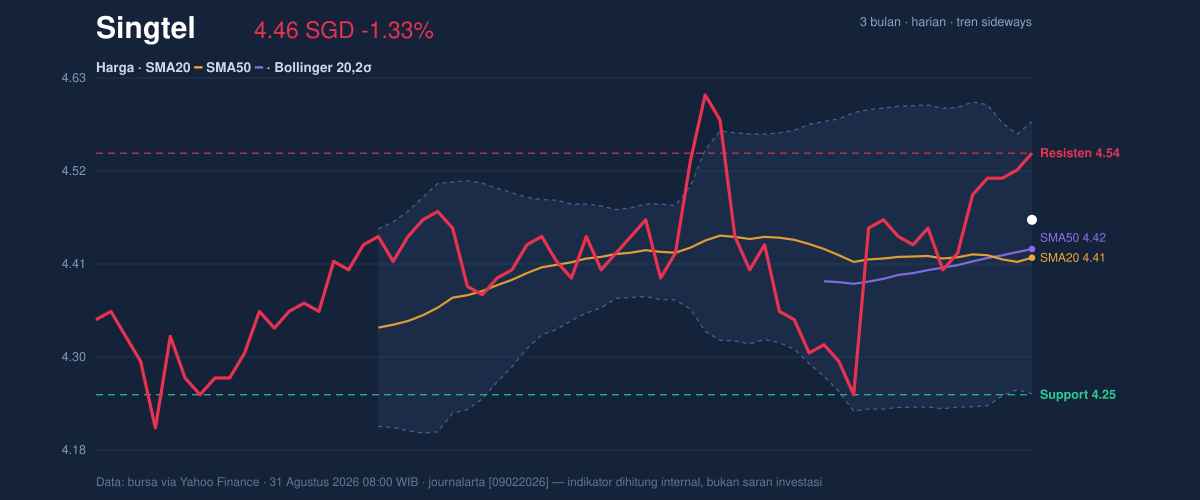
The chart also places price at 72% of the 20-day range, which is important in plain terms: the stock is closer to the top of its recent corridor than the bottom, but not yet at a breakout point. That position is reinforced by the 20-day resistance at 4.54, only slightly above the last price, while the nearest floor is 4.25. In other words, the market is compressing between a modest overhead barrier and a clear support zone, which often precedes a sharper move once one side gives way.
The broader three-month range adds context. The shares have traded between 4.70 and 4.15, so the current level is still below the recent peak but comfortably above the lower end. That tells investors the stock has recovered from weakness, yet it has not reclaimed the upper boundary that would signal stronger confidence.
Oscillators & Momentum
Momentum is stronger than the moving averages alone suggest, but it is not cleanly aligned. RSI at 60.9 is still neutral, which means the stock is neither washed out nor stretched to an extreme. That matters because RSI is often read as a temperature gauge: above 70 is commonly considered overheated, below 30 oversold. Singtel is sitting in the middle zone, where price can still move either way without requiring an immediate reversal.
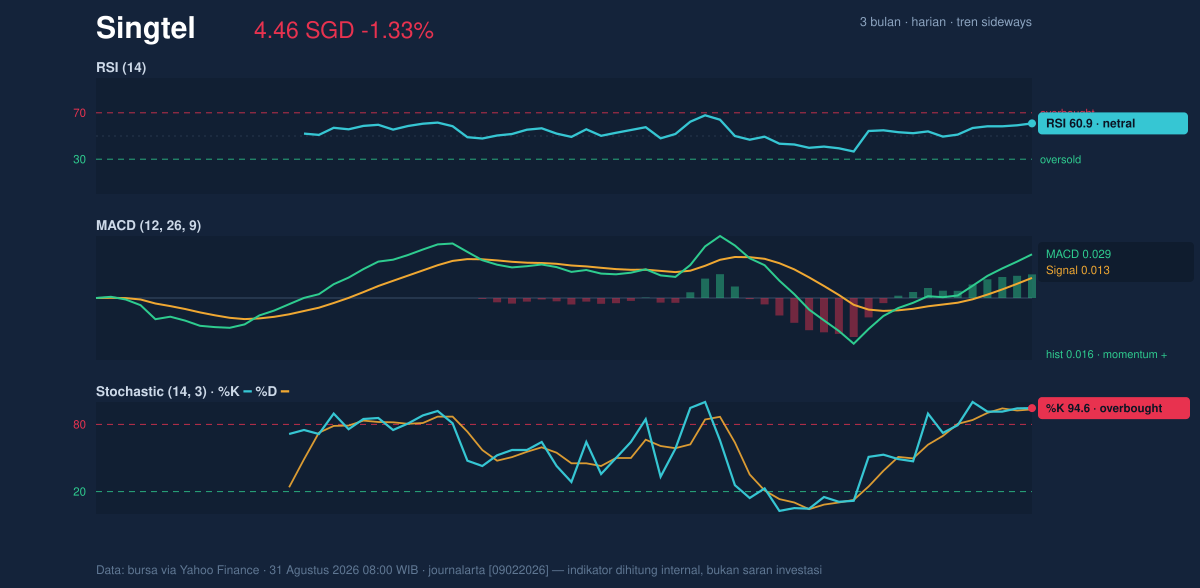
The more striking signal comes from stochastic, where %K at 94.6 and %D at 93.4 are both overbought. This does not automatically mean the stock must fall, but it does mean recent buying has been fast and crowded. When stochastic is that elevated, the market is often telling you that momentum has run ahead of the underlying trend, so even a small pause can trigger a pullback.
MACD, however, is still supportive. The MACD at 0.029 sits above the signal line at 0.013, with a positive histogram of 0.016. That configuration usually indicates the short-term trend is still improving relative to the recent baseline. The important nuance is that MACD is positive while the moving-average structure is weak, so the stock is in a tug-of-war between recovering momentum and a still-cautious trend backdrop.
Volatility & Volume
Volatility is moderate, not explosive. ATR at 0.08, or 1.7% of price, suggests the stock typically moves in controlled daily increments rather than wide swings. That tends to favour patience, because a breakout or breakdown may need a few sessions to develop rather than one dramatic day.
The Bollinger Bands add a more interesting layer. Price is sitting inside the band structure with %B at 64%, meaning it is above the middle band but not pressing the upper band at 4.58. The band width is only 7.4%, described in the data as a squeeze, and that is often a setup for expansion. In simple terms, the stock has been coiling; coiled charts eventually resolve, but the direction is not guaranteed.
Volume supports the idea that investors are paying attention. Last volume of 31,881,600 was about 1.2× normal versus the 20-session average of 26,911,604, and OBV is rising. That combination matters because price gains backed by stronger participation are generally more credible than gains on thin trading. Rising OBV suggests net accumulation, even though the market has not yet converted that interest into a decisive breakout above resistance.
Key Levels & Scenarios
The immediate map is clear. Support at 4.25 is the level that matters most on the downside, while resistance at 4.54 is the first hurdle on the upside. If price clears 4.54 with follow-through, the next reference becomes the upper Bollinger band at 4.58, and then the 3-month high at 4.70. If price fails to hold 4.25, the chart would reopen the lower part of the recent range and weaken the case for the current stabilisation attempt.
The signal mix is therefore neither bearish nor decisively constructive. The stock has enough momentum and volume to keep the upside argument alive, but the death cross and overbought stochastic warn that the next move may be choppy rather than linear. As shown in the chart, the market is compressed between support and resistance, and those kinds of setups usually reward confirmation more than anticipation.
Technical Verdict: HOLD (wait & see)
HOLD (wait & see)
- MACD is positive and the histogram remains above zero, so short-term momentum has not broken down.
- Stochastic is overbought while the chart still shows a death cross, which argues for caution rather than urgency.
- Volume is 1.2× normal and OBV is rising, so participation is improving, but price has not yet cleared resistance.
Verdict invalidated if price falls below 4.25.
- Ideal Entry Range: 4.25 to 4.41
- Exit Target: 4.54 to 4.58
- Stop Loss protection: below 4.25
For non-traders, this means Singtel is holding up, but it still needs to prove that the recent bounce is stronger than the sell signal in the moving averages.
Summary Data Singtel
| Last price | 4.46 SGD |
| Change 1 day / 5 days / 1 month | -1.33% / 0.90% / 0.45% |
| Trend / MA-cross | sideways / death |
| SMA20 / SMA50 | 4.41 / 4.42 |
| RSI (14) / Stochastic %K | 60.9 / 94.6 |
| Bollinger %B / ATR | 64% / 0.08 |
| Support / Resistance 20 days | 4.25 / 4.54 |
| Data as of | 31 Agustus 2026 08:00 WIB |
Track Singtel share price daily: live levels, support/resistance and our full Singtel analysis history.



