Tencent Stock Drops 3.03%, Testing Support Level In Focus
On September 2, 2026: price 441.40 HKD, trend sideways, RSI 49.3, support 440.00, resistance 492.20. technical analysis of tencent stock.
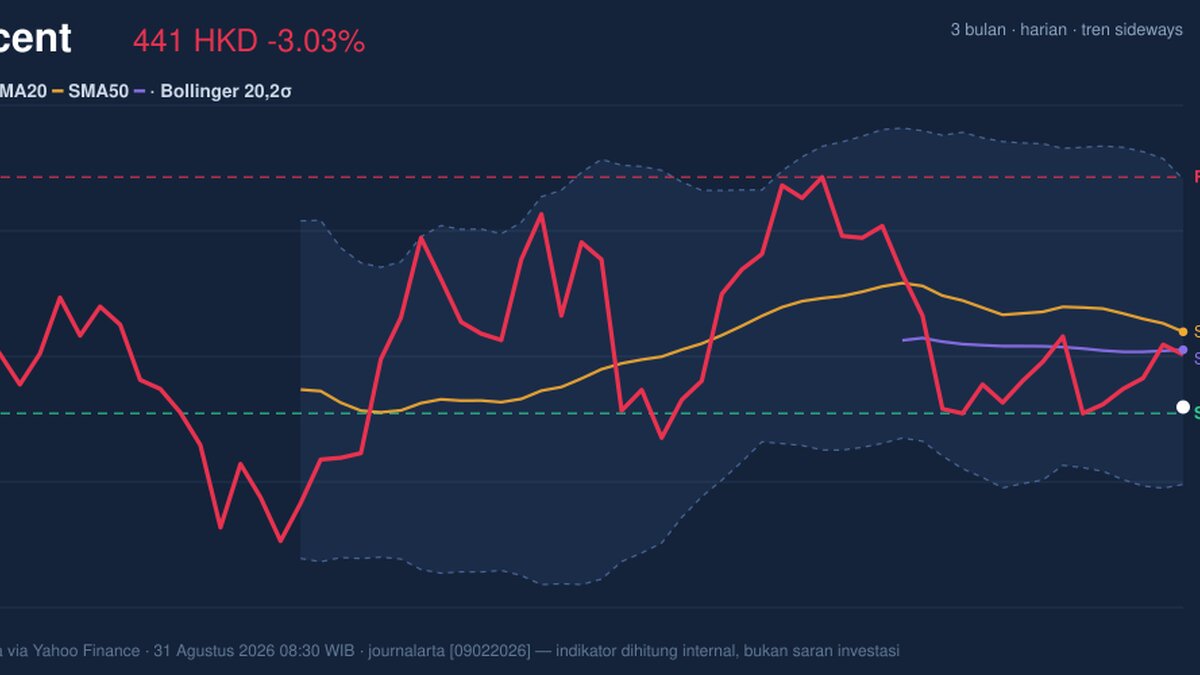
Tencent Holdings slipped on the Hong Kong stock exchange to HKD 441.40, down 3.03% from the previous close of HKD 455.20, as the stock moved back toward the lower half of its recent trading band and remained below both short- and medium-term averages. The tape says the market is not in panic, but it is not rewarding the name either: Tencent is sitting in a sideways structure, with price still below the SMA20 at HKD 458.02 and the SMA50 at HKD 454.06, while momentum has turned softer than price alone might suggest. That combination matters because it shows sellers have enough control to keep the stock under its trend lines, yet not enough conviction to force a breakdown through the broader range floor.
Trend & Price Action
As shown in the chart, Tencent is trading in a sideways trend, but the slope of the SMA20 is -1.16% over 5 days, which is a subtle warning that the range is leaning lower rather than flat. The stock’s position below the SMA20 and SMA50 tells traders that recent rebounds have not yet regained trend authority. In plain terms, the market is still pricing Tencent below where it has been comfortable trading, and that usually means rallies are being sold before they can prove themselves.
The broader range also frames the story. Tencent is near the lower part of the three-month corridor, with a 3-month high of HKD 497.80 and a 3-month low of HKD 411.00. That places the current price closer to support than resistance, but not close enough to call it a clean base. The immediate 20-hour support at HKD 440.00 is especially important because the last price is essentially sitting on top of it.
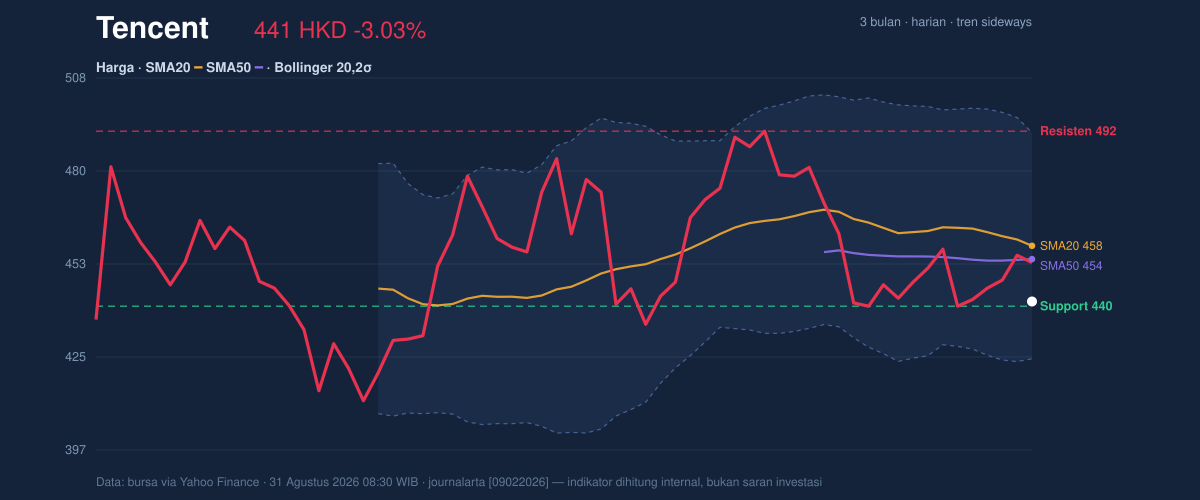
A stock that trades this close to support can stabilize quickly — or slip just as fast.
Oscillators & Momentum
The momentum picture is mixed, and that is the key signal. The RSI at 49.3 is neutral, which means Tencent is neither stretched to the upside nor washed out. The Stochastic %K at 54.5 and %D at 39.8 is also neutral, but with %K above %D it hints at a modest short-term lift rather than a decisive turn. That is not enough on its own to overturn the broader weakness, yet it does suggest the stock is not in a deeply oversold condition.
The more telling indicator is the MACD at -3.198, below its signal line at -2.795, with a histogram of -0.404. That negative spread means downside momentum is still active, even if it is not accelerating aggressively. In practical terms, the stock is losing altitude, but not in a sharp breakdown; it is more of a controlled drift lower. That often leaves room for either a bounce from support or another leg down if buyers stay passive.
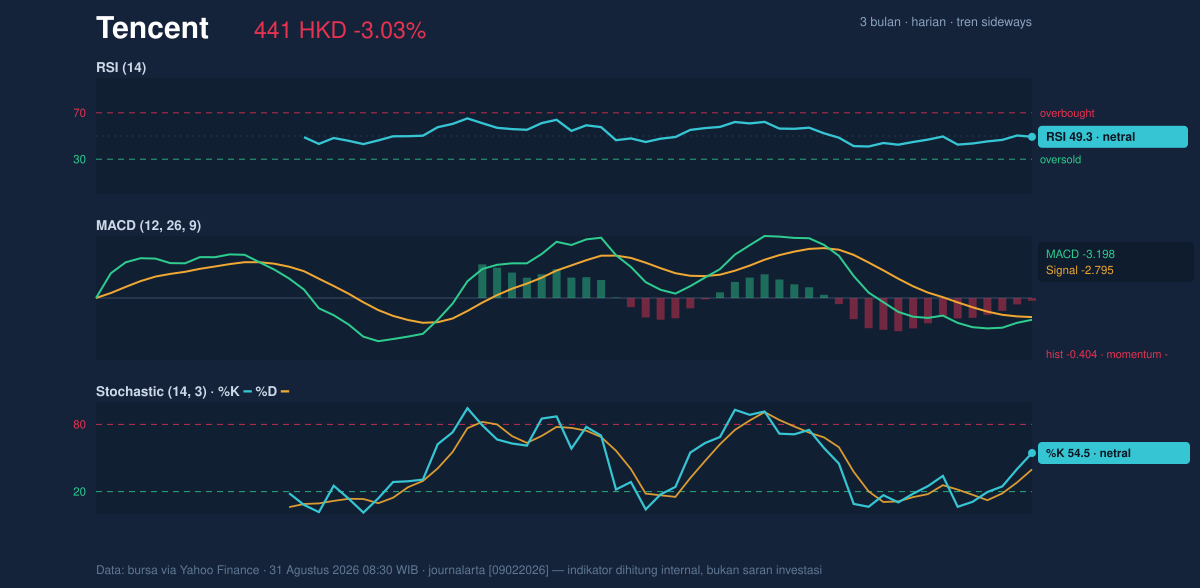
The oscillators do not confirm a strong reversal yet.
Volatility & Volume
Tencent’s Bollinger Bands help explain why the move feels contained. The upper band is HKD 491.72, the middle band is HKD 458.02, and the lower band is HKD 424.32. With %B at 25%, price is trading in the lower quarter of the band structure, which usually signals weakness but not necessarily panic. Importantly, the band width is 14.7%, described as normal, so this is not a volatility squeeze that typically precedes an explosive move. It is more a steady, ordinary market that can still trend lower if pressure persists.
ATR adds another layer. The ATR(14) of 11.93, or 2.7% of price, indicates moderate daily movement. That means Tencent can move enough to test support and resistance in a single session, but not so violently that every swing rewrites the technical picture. Volume is slightly softer than usual: 20,149,770 shares versus an average 23,467,384, or 0.9x normal. That matters because the latest decline did not arrive with heavy participation, which reduces the urgency of the selloff. Still, the OBV is rising, and that is a useful counter-signal: on-balance volume suggests money flow has not fully abandoned the name, even if price has not yet reflected it.
Quiet volume, but not empty volume.
Key Levels & Scenarios
The market is now centered on a narrow decision zone. The nearest support is HKD 440.00, while the nearest resistance is HKD 492.20. With the stock trading within 3% of the support zone, the next few sessions are likely to be defined by whether buyers defend this area or whether the price slips toward the lower Bollinger band at HKD 424.32. A hold above support would keep the stock inside the current range and allow for a test of the middle band around HKD 458.02. Failure there would leave the upper band and resistance far out of reach.
If Tencent loses HKD 440.00, the chart would point toward the lower band and then the broader three-month low at HKD 411.00. If it reclaims the SMA20 at HKD 458.02, the tone improves because the stock would be back above the level that currently acts as the market’s pivot.
Technical Verdict: HOLD (wait & see)
HOLD (wait & see)
- MACD remains negative, so downside momentum is still present even though it is not accelerating.
- Price is below both the SMA20 and SMA50, which means the stock has not yet reclaimed trend control.
- RSI and Stochastic are neutral, so there is no strong oversold signal to justify calling an immediate reversal.
Verdict invalidated if price breaks below HKD 440.00, because that would weaken the current support shelf and open the way toward the lower Bollinger band at HKD 424.32 and the three-month low at HKD 411.00.
- Ideal Entry Range: HKD 440.00 to HKD 445.00
- Exit Target: HKD 458.02 to HKD 492.20
- Stop Loss protection: Below HKD 424.32
For non-traders, this means Tencent is sitting at a level where the chart needs proof before it can be trusted again.
“The next close around HKD 440.00 will tell us whether this is a pause or the start of a deeper slide.”
Summary Data Tencent
| Last price | 441.40 HKD |
| Change 1 day / 5 days / 1 month | -3.03% / 0.32% / -9.99% |
| Trend / MA-cross | sideways / none |
| SMA20 / SMA50 | 458.02 / 454.06 |
| RSI (14) / Stochastic %K | 49.3 / 54.5 |
| Bollinger %B / ATR | 25% / 11.93 |
| Support / Resistance 20 days | 440.00 / 492.20 |
| Data as of | 31 Agustus 2026 08:30 WIB |
Track Tencent share price daily: live levels, support/resistance and our full Tencent analysis history.



