Testing Support Level, Alibaba Stock Drops 3.07% Today
On September 2, 2026: price 110.40 HKD, trend sideways, RSI 44.2, support 112.50, resistance 128.10. technical analysis of alibaba stock.
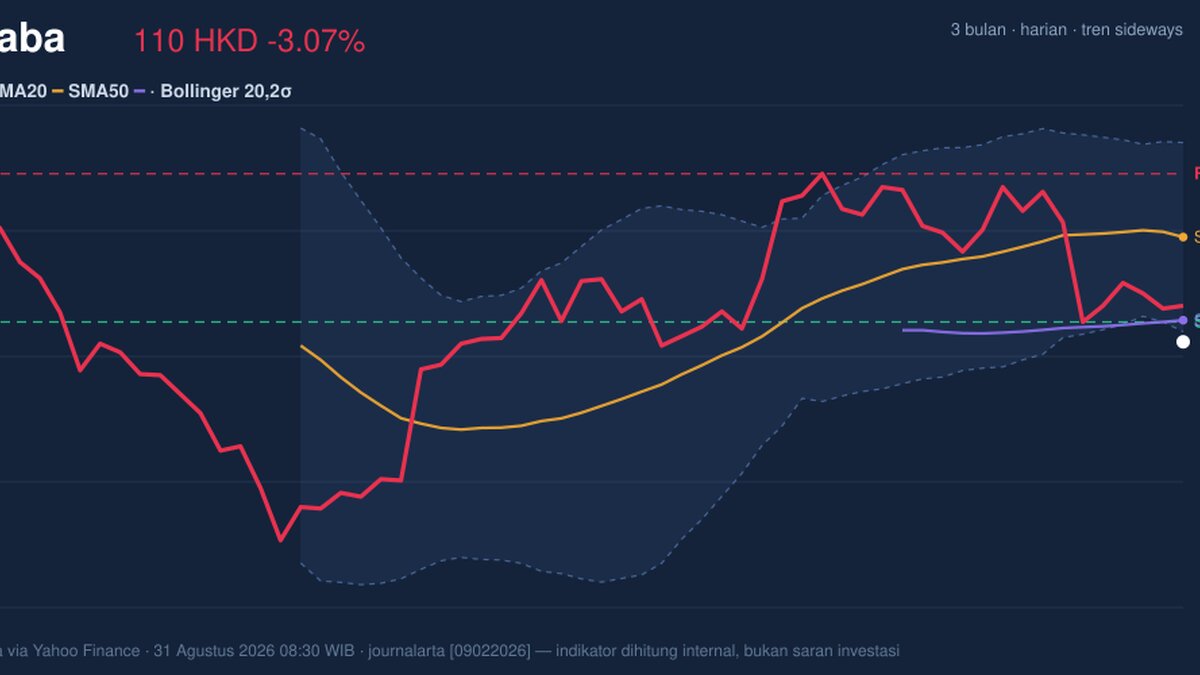
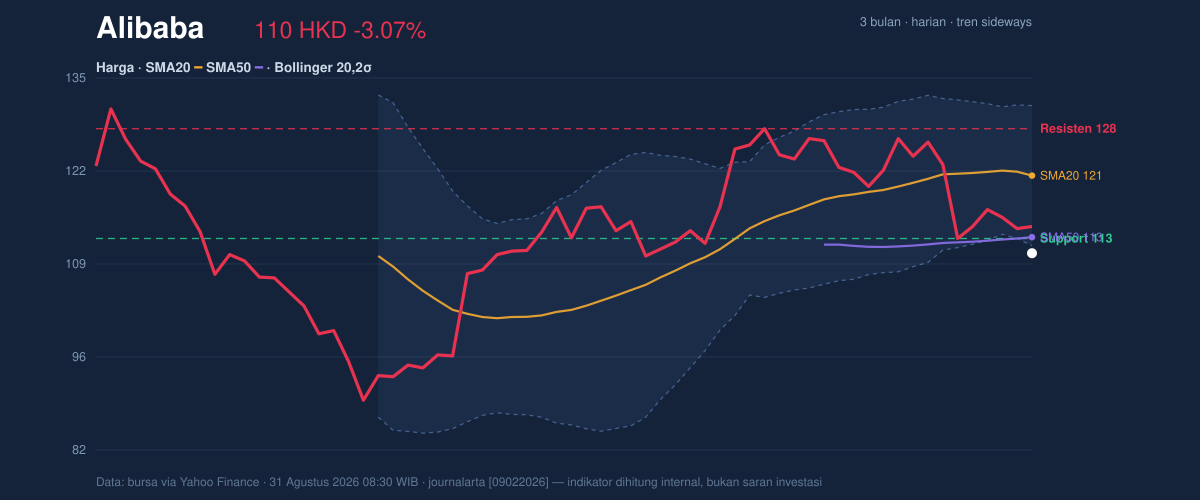
Alibaba Group’s Hong Kong-listed shares fell to HKD 110.40 on the HKEX, extending a weak month that has left the stock trading below both its short- and medium-term trend markers, according to exchange data and the latest technical readout. The move is not just a one-day slip: it places the shares under the SMA20 at 121.44 and the SMA50 at 112.67, while the price is also sitting near the lower edge of the Bollinger band structure. In plain terms, the stock is no longer drifting in the middle of its range; it is pressing against the lower end, where sellers have recently had the upper hand.
The chart suggests a market that is still searching for footing rather than forming a clean rebound.
Trend & Price Action
The broader setup is best described as sideways, but that label hides the recent deterioration. The SMA20 is sloping down at -0.21% over 5 days, which means the short-term trend is tilting lower even if the longer pattern has not yet broken into a full downtrend. More importantly, the share price is below the SMA20 and also below the SMA50, a combination that usually tells traders the stock has lost near-term momentum and has not yet reclaimed enough strength to attract consistent trend-following buying.
There is no fresh MA-cross to point to a new trend regime, so the message from moving averages is not a dramatic reversal signal but a slow erosion of support. The current price also sits 13% below the 20-hour resistance zone at 128.10, which shows how far the stock remains from the upper part of its recent trading band. That distance matters: when price is parked near the lower end of a range, rallies often need volume and momentum confirmation before they can stick.
The lower Bollinger band at 111.49 is especially relevant because the stock is already trading just under it. That means the market is not merely weak; it is stretched toward the downside boundary of its recent volatility envelope.
Oscillators & Momentum
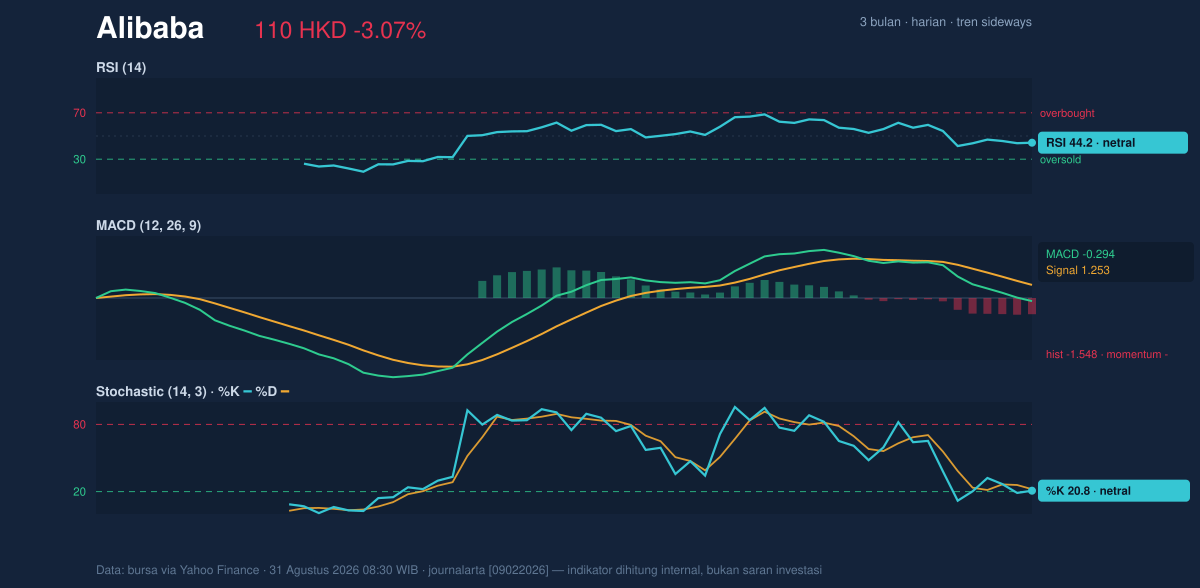
Momentum indicators are not yet giving a clean oversold reversal signal. The RSI at 44.2 is neutral, which tells us the stock is neither deeply washed out nor showing enough strength to suggest buyers have taken control. The Stochastic %K at 20.8 and %D at 22.1 are also in neutral territory, but they are hovering near the lower end of the scale, which often means the stock is close to short-term exhaustion without confirming a turn. In other words, the indicators are weak, but not weak enough to justify calling a rebound complete.
The more important warning comes from the MACD line. With MACD at -0.294, a signal line at 1.253, and a histogram at -1.548, momentum is clearly negative. For general readers, MACD is a trend-following gauge: when the main line sits below the signal line and the histogram is negative, it usually means downside pressure is still dominant. That is exactly what the chart shows here.
The momentum panel is therefore not confirming the price weakness with panic, but it is confirming it with persistence.
Volatility & Volume
Volatility is elevated, even if the Bollinger band width is described as normal. The ATR(14) at 4.74 equals 4.3% of price, which means daily swings remain large enough to matter. ATR, or average true range, is a measure of how much the stock typically moves in a session; at this level, the market can travel a meaningful distance without needing a major news catalyst. That makes the current zone fragile: small changes in sentiment can push the stock through nearby technical levels quickly.
Volume does not yet support a recovery thesis. Last session volume was 82,619,229, below the 20-day average of 99,545,709, or about 0.8x normal. Lower-than-average volume on a decline can sometimes suggest the selling is not forceful, but here it is paired with OBV trending down, which is more important. OBV, or on-balance volume, tracks whether volume is flowing into or out of the stock; a falling OBV indicates that participation has been leaning toward distribution rather than accumulation.
That combination — weaker price, lower OBV, and only average-to-soft turnover — says the market has not yet produced the kind of broad participation usually needed to reverse a slide.
Key Levels & Scenarios
The immediate technical map is straightforward. Support sits at 112.50, while resistance is 128.10. The stock is currently below support, which is a sign of short-term vulnerability rather than stability. The 3-month range adds context: the stock’s 3-month high is 131.20 and the 3-month low is 88.65. That tells readers the shares are not in a deep breakdown, but they are also not far from the lower half of the recent range.
If the stock can reclaim 112.50 and then move back above the 111.49 lower Bollinger band, it would reduce immediate downside pressure and suggest the market is trying to re-enter its prior range. If it fails to hold that area, the chart leaves little cushion before the next meaningful reference points.
The key signal is whether price can get back inside the band and stay there.
[HARD FACT]
Technical Verdict: HOLD (wait & see)
HOLD (wait & see)
- MACD is negative, with the histogram at -1.548, showing downside momentum still dominates.
- Price is below SMA20 at 121.44 and SMA50 at 112.67, so the stock has not regained its short- or medium-term trend structure.
- Volume is only 0.8x normal and OBV is falling, which means the market has not yet shown convincing accumulation.
Verdict invalidated if price breaks back above 128.10 and sustains that move with stronger participation.
- Ideal Entry Range: 111.49 to 112.50
- Exit Target: 121.44, then 128.10
- Stop Loss: below 111.49, with the next protection level at 112.50 if that band fails
For non-traders: the chart says Alibaba is weak but not broken, and it needs to reclaim lost ground before the trend can be called healthier.
Summary Data Alibaba
| Last price | 110.40 HKD |
| Change 1 day / 5 days / 1 month | -3.07% / -1.87% / -11.82% |
| Trend / MA-cross | sideways / none |
| SMA20 / SMA50 | 121.44 / 112.67 |
| RSI (14) / Stochastic %K | 44.2 / 20.8 |
| Bollinger %B / ATR | -5% / 4.74 |
| Support / Resistance 20 days | 112.50 / 128.10 |
| Data as of | 31 Agustus 2026 08:30 WIB |
Track Alibaba share price daily: live levels, support/resistance and our full Alibaba analysis history.



