UOB Stock Gains 1.57%, Death Cross Pressure In Focus
On September 2, 2026: price 41.42 SGD, trend downtrend, RSI 49.8, support 40.22, resistance 43.58. technical analysis of uob stock. UOB Stock Gains — full…
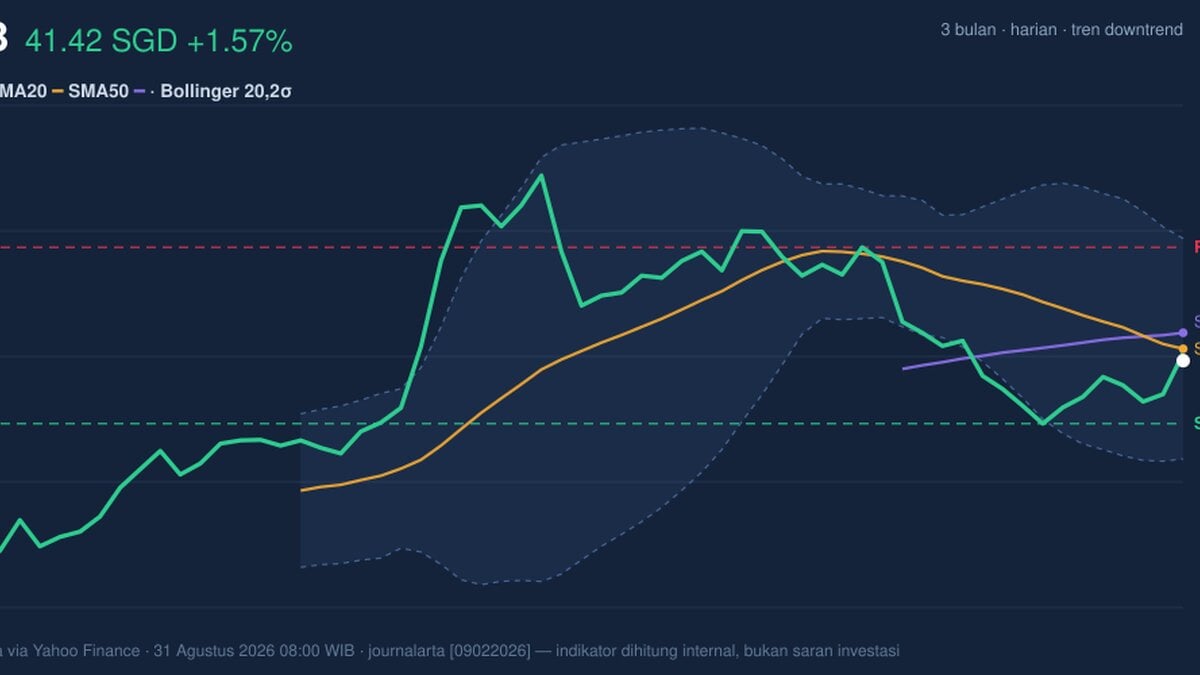
United Overseas Bank’s shares on SGX rose to SGD 41.42 by 31 August 2026, a modest rebound from the previous close of 40.78, but the move still leaves the stock below its short-term trend markers and inside a broader corrective phase. The price action matters here because the latest gain is not yet a clean trend reversal; it is more a sign that buyers are still willing to step in after weakness, even as the chart continues to show a market that is trying to stabilise rather than break decisively higher.
Trend & Price Action
As shown in the chart, UOB is trading below its SMA20 at 41.65 and below its SMA50 at 41.95, which keeps the stock on the defensive in the near term. The death cross — where the 20-day average has crossed below the 50-day average — is a technical signal that usually means recent price momentum has weakened enough to overtake the medium-term trend. In plain English, it tells readers that the market has not yet proved that the last few weeks of softness are over.
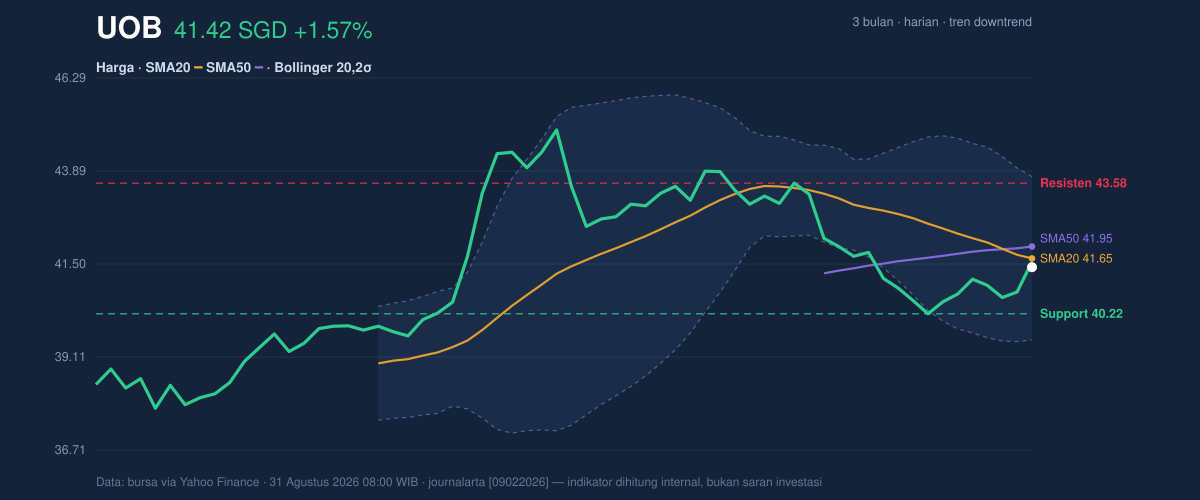
The slope of the SMA20 is -1.51% over 5 days, reinforcing that the short-term trend is still pointing down. That said, the stock’s latest close is above the 20-hour support at 40.22 and sits at roughly the lower-middle part of the recent trading range, with the price at 36% of that band. That positioning suggests UOB is not collapsing, but it is also not reclaiming enough ground to shift the chart back into a clear recovery pattern. The 3-month range of 45.15 to 37.52 frames the current move as a consolidation within a wider swing, not a fresh breakout.
Oscillators & Momentum
The momentum picture is mixed, and that is important because mixed signals often mean the market is waiting for confirmation. The RSI at 49.8 is essentially neutral, which tells us the stock is neither overbought nor oversold. That matters because it leaves room for movement in either direction; the oscillator is not warning of exhaustion, but it is also not confirming a strong recovery.
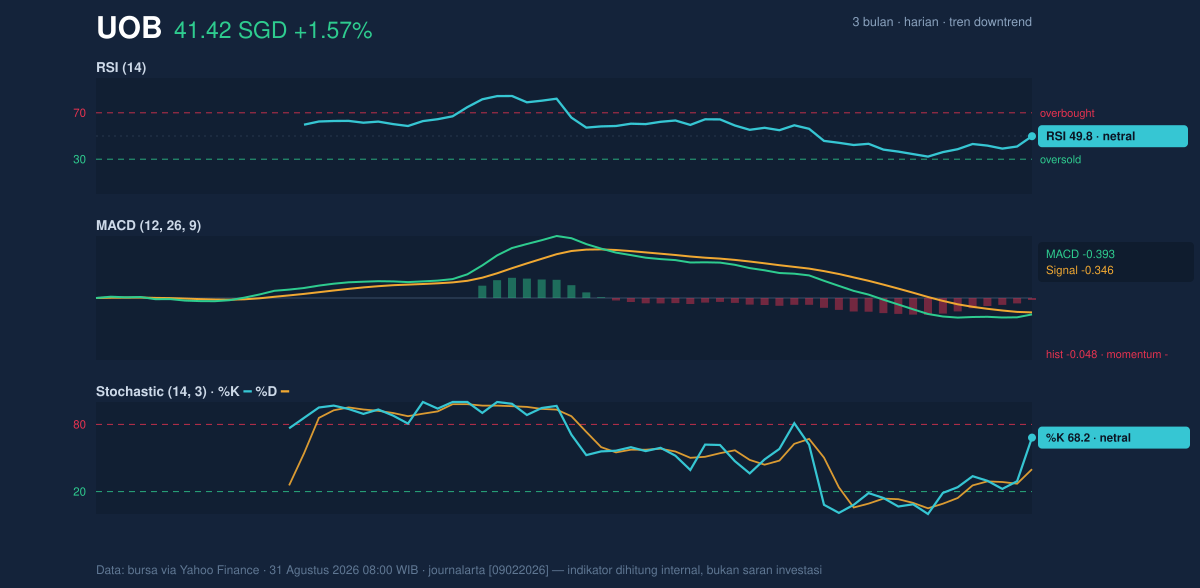
The Stochastic %K at 68.2 and %D at 40.0 also point to a market that is rebuilding from weakness without yet delivering full alignment. Stochastic measures where the latest price sits relative to its recent range, so a higher %K than %D can hint at short-term improvement, but the gap is not enough on its own to call a trend turn. More telling is the MACD at -0.393, below its signal line at -0.346, with a negative histogram of -0.048. That combination means downside momentum still has a slight edge, even if the gap is not wide. In practical terms, the chart is saying that sellers have not fully lost control.
Volatility & Volume
Volatility is restrained for now. The ATR at 0.55, or 1.3% of price, indicates relatively low day-to-day movement, while the Bollinger Band width of 10.1% is described as normal rather than compressed. This matters because a normal band width with low ATR suggests the stock is not in a pressure-cooker setup; it is moving, but not with the kind of tension that usually precedes a sharp technical break.
The Bollinger position is also instructive. With the middle band at 41.65, the stock is trading just under the centre line, and %B at 45% shows price sitting below the midpoint of the envelope, but not near the lower band at 39.55. That combination indicates UOB is still below its short-term average, yet not under immediate technical stress. Meanwhile, volume last traded at 6,077,800, about 1.6× the 20-hour average of 3,702,930, and OBV is rising. That is the most constructive part of the setup: heavier participation on a bounce often means the market is paying attention, and rising OBV suggests net buying pressure is improving even if price has not fully caught up.
Key Levels & Scenarios
The nearest support is 40.22, and the nearest resistance is 43.58. Those two levels are now the main map for the chart. If price can reclaim the SMA20 at 41.65 and then push through 43.58, the recent rebound would start to look more credible, especially if volume stays above average. If instead the stock slips back below 40.22, the market would be signalling that the bounce lacked follow-through and that sellers are still defending the lower end of the range.
The wider Bollinger lower band at 39.55 becomes the next technical cushion if the 20-hour support fails. Because ATR remains low, a break in either direction may not be explosive at first, but it could still matter because low-volatility periods often resolve once the market picks a direction.
Technical Verdict: HOLD (wait & see)
HOLD (wait & see)
- MACD remains negative, so downside momentum has not fully cleared.
- Price is below SMA20 and SMA50, with a death cross still in force.
- Volume is 1.6× average and OBV is rising, which supports the bounce but does not yet confirm a trend reversal.
Verdict invalidated if price falls below 40.22.
- Ideal Entry Range: 40.22 to 41.65
- Exit Target: 43.58
- Stop Loss protection: 39.55
In plain English, the stock is showing signs of life, but it has not yet proven that the downtrend is over.
Summary Data UOB
| Last price | 41.42 SGD |
| Change 1 day / 5 days / 1 month | 1.57% / 1.69% / -4.56% |
| Trend / MA-cross | downtrend / death |
| SMA20 / SMA50 | 41.65 / 41.95 |
| RSI (14) / Stochastic %K | 49.8 / 68.2 |
| Bollinger %B / ATR | 45% / 0.55 |
| Support / Resistance 20 days | 40.22 / 43.58 |
| Data as of | 31 Agustus 2026 08:00 WIB |
Track UOB share price daily: live levels, support/resistance and our full UOB analysis history.



