XOM Testing Key Resistance: Stock Gains 2.24% (September 2, 2026)
On September 2, 2026: price 164.55 USD, trend uptrend, RSI 61.0, support 151.63, resistance 166.15. technical analysis of xom stock. XOM Testing Key Resistance…
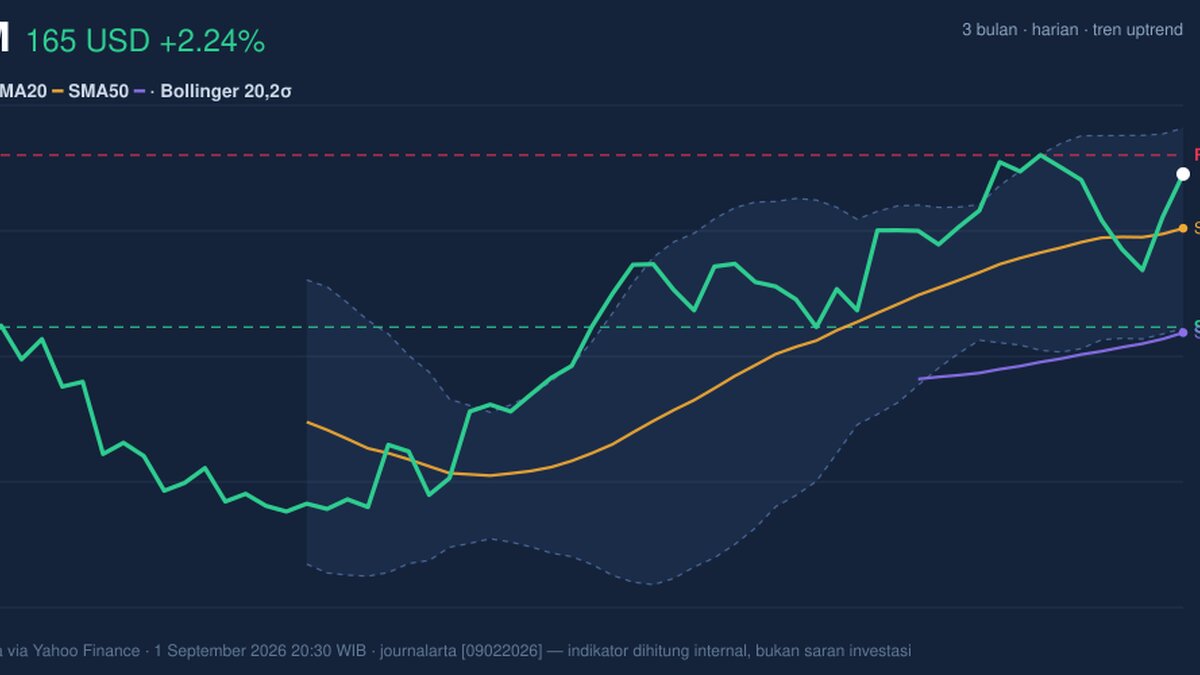
ExxonMobil shares rose to 164.55 on the NYSE, up 2.24% from the previous close of 160.95, as the stock extended a short-term uptrend while still trading below its nearest overhead barrier, according to Yahoo Finance data as of 1 September 2026 20:30 WIB. The move matters because XOM is now sitting close to the upper end of its recent trading range, which usually signals strength, but not yet the kind of breakout that confirms a fresh leg higher.
Trend & Price Action
The chart shows XOM holding comfortably above both its SMA20 at 159.97 and SMA50 at 151.16, a constructive setup that tells traders the stock is still trading above its short- and medium-term trend lines. In plain English, that means recent buyers have been willing to pay more than the average price of the last 20 and 50 sessions, which is typically a sign that momentum is still leaning upward.
There is no new MA-cross, so the message from the moving averages is steady rather than dramatic. The SMA20 slope of 0.74% over 5 days reinforces that the nearer trend is still rising, but the absence of a fresh crossover suggests the move is more of a continuation than a new technical regime.
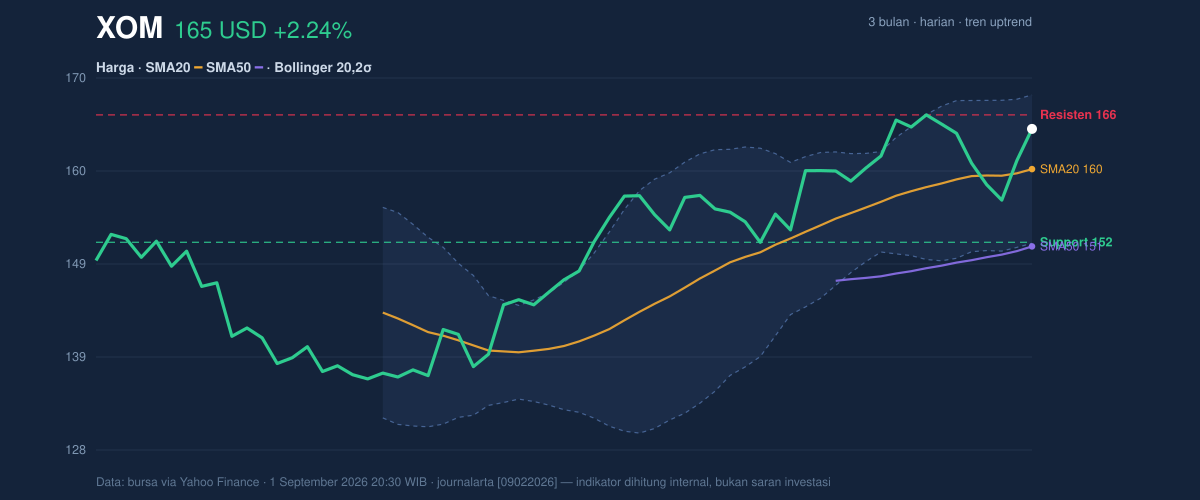
Price is also positioned at about 89% of the 20-hour range, with the stock trading between 151.63 support and 166.15 resistance. That placement tells you XOM is pressing toward the top of the recent band, where gains often become harder to extend unless volume confirms the push. The stock remains below its 3-month high of 168.64, so the market has not yet fully reclaimed the upper boundary of the broader recent range.
Oscillators & Momentum
The momentum picture is more mixed than the price trend. The RSI at 61.0 is neutral, which means the stock is not stretched into overbought territory and still has room to advance without immediately looking overheated. At the same time, neutrality also means the oscillator is not providing a strong acceleration signal on its own.
The Stochastic %K at 67.3 and %D at 39.9 points to improving short-term momentum, but not yet a fully confirmed thrust. Stochastic compares the latest price to its recent range; when it rises ahead of price confirmation, it can hint that buyers are reasserting control, though the signal is still early here.
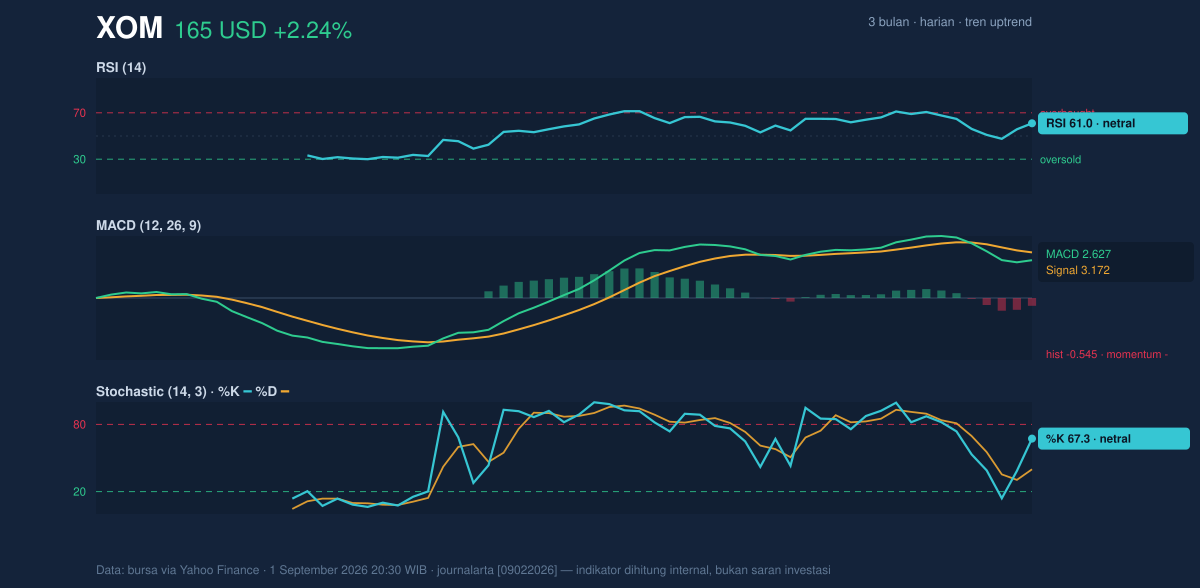
The more important caution comes from MACD. XOM’s MACD at 2.627 remains above zero, which generally means the broader trend is still positive, but it sits below the signal line at 3.172 and the histogram at -0.545 is negative. That combination means upside momentum has slowed even as the price itself has stayed firm. In practical terms, the trend is intact, but the engine behind it is not yet firing as strongly as the chart position suggests.
Volatility & Volume
Volatility is not signaling panic or compression. The ATR(14) at 3.35, equal to about 2.0% of price, indicates moderate daily movement. That matters because it suggests the stock can still make a meaningful move, but not one that implies extreme turbulence.
Bollinger Bands paint a similar picture. With the upper band at 168.43, the middle band at 159.97, and the lower band at 151.51, XOM is trading above the center line and near the upper half of the envelope. The %B at 77% says price is leaning toward the upper band without yet touching it, which usually indicates strength, but also a market that may need a pause if buyers fail to broaden participation. The 10.6% band width is normal, so this is not a squeeze setup that would typically precede a sharp volatility burst.
Volume is the clearest soft spot in the story. Last trade volume of 11,381,800 was only 0.8× the 20-day average of 14,261,315, while OBV is falling. OBV, or on-balance volume, tracks whether volume is flowing into gains or into declines; a falling line during a price rise often means the rally is not being broadly supported. That does not invalidate the trend, but it does warn that the latest advance is less convincing than the price alone would imply.
Key Levels & Scenarios
The immediate technical map is straightforward. 166.15 is the first resistance that matters, and 168.43 is the Bollinger upper band that can act like a ceiling if momentum weakens. On the downside, 159.97 is the first meaningful support because it is both the SMA20 and Bollinger midline, while 151.63 is the lower near-term support and 151.51 is the lower band.
If XOM clears 166.15 with better participation, the chart would be pointing toward a retest of the 168.43 to 168.64 zone. If it fails to hold 159.97, the tone changes quickly because the stock would be slipping back toward the lower half of the recent range, where the next test becomes 151.63.
Technical Verdict: HOLD (wait & see)
HOLD (wait & see)
- Price is above SMA20 and SMA50, which keeps the trend constructive.
- MACD histogram is negative, showing momentum is losing some force even as price stays elevated.
- Volume is below average and OBV is falling, so the latest rise lacks strong participation.
Verdict invalidated if price breaks below 151.63, because that would put XOM back under the nearest support and closer to the lower Bollinger band.
- Ideal entry range: 159.97 to 166.15
- Exit target: 168.43 to 168.64
- Stop loss protection: 151.63
In plain English, XOM still looks technically healthy, but the rise is not yet backed by enough momentum and volume to call it decisive. The next scheduled reference point for traders is whether price can hold above 159.97 and challenge 166.15 again.
Summary Data XOM
| Last price | 164.55 USD |
| Change 1 day / 5 days / 1 month | 2.24% / 0.30% / 6.12% |
| Trend / MA-cross | uptrend / none |
| SMA20 / SMA50 | 159.97 / 151.16 |
| RSI (14) / Stochastic %K | 61.0 / 67.3 |
| Bollinger %B / ATR | 77% / 3.35 |
| Support / Resistance 20 days | 151.63 / 166.15 |
| Data as of | 1 September 2026 20:30 WIB |
Track XOM stock price daily: live levels, support/resistance and our full XOM analysis history.



