AIA Stock Analysis: Drops 0.33%, Death Cross Pressure
On September 3, 2026: price 76.00 HKD, trend sideways, RSI 54.4, support 70.40, resistance 77.75. technical analysis of aia stock. AIA Stock Analysis — full…
By matthew jonathan
September 2, 20265 min read
AIA Stock Analysis
76.00 HKD is holding above its 20-day average, but AIA Group’s chart is sending mixed signals: the stock sits in the upper part of its recent range, yet the death cross between the 20-day and 50-day moving averages still points to a market that has not fully repaired its medium-term structure. At the same time, the latest price is close to the top of the Bollinger band and momentum oscillators are stretched, which means the recent bounce is real but not yet fully confirmed by participation.
Trend & Price Action
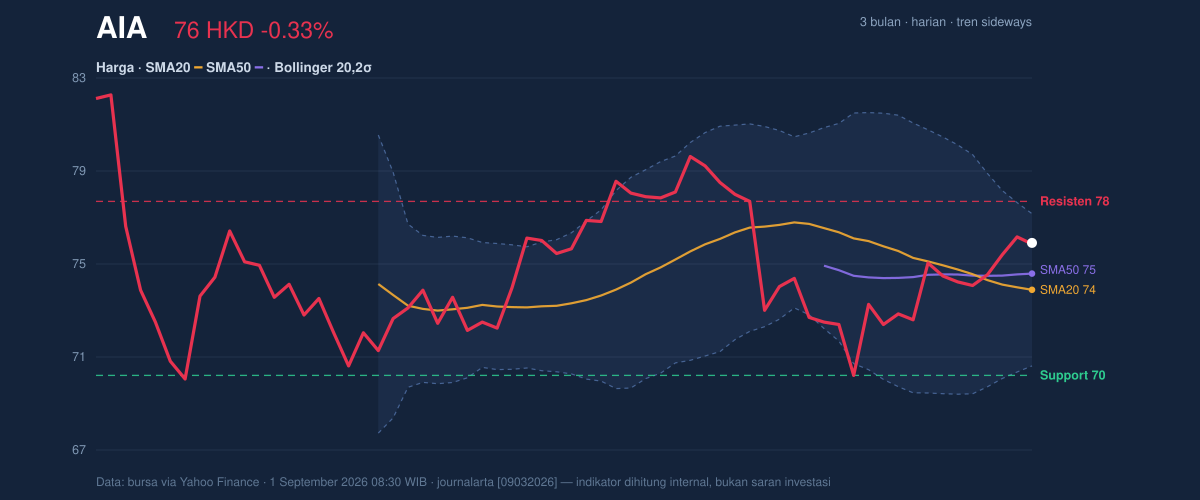
AIA closed at 76.00 HKD, down 0.33% on the day, but still up 2.22% over five days. That combination matters. It suggests the stock is not in a clean downtrend; rather, it is trying to stabilize after a softer month, with the 1-month move of -2.63% showing that recent gains have not yet erased the broader drift lower.
The key structural signal is the moving-average setup. Price is above SMA20 at 74.02, which usually indicates short-term buyers are still willing to defend dips. But the SMA20 remains below SMA50 at 74.70, a death cross that signals the medium-term trend is still weaker than the short-term rebound. In plain language, the stock has stopped falling cleanly, but it has not yet proven that the earlier weakness is over.
As shown in the chart, the share price is sitting at about 76% of its 20-day range, with 20-day support at 70.40 and 20-day resistance at 77.75. That placement is important: the market is trading closer to resistance than support, so the next move is more likely to be judged by whether buyers can force a break higher or whether the recent rally simply runs out of steam.
3-month price action chart of AIA: price, SMA20/50, Bollinger, support & resistance. Data: exchange via Yahoo Finance.
Oscillators & Momentum
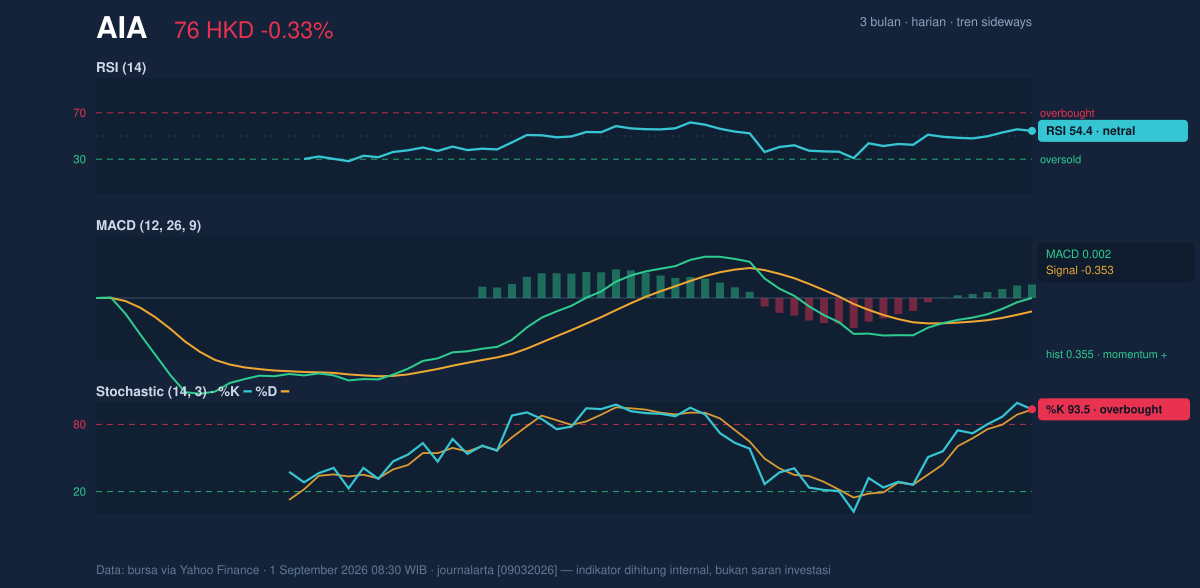
The momentum picture is more conflicted than the price chart. The RSI at 54.4 is neutral, which means the stock is neither oversold nor overbought on a broader momentum basis. That usually leaves room for movement in either direction.
But the Stochastic reading of %K 93.5 and %D 93.2 is clearly overbought. This does not automatically mean the stock must fall, but it does mean the recent climb has moved quickly and may be vulnerable to pauses or pullbacks if fresh demand does not appear. When stochastic is this elevated while RSI is still only neutral, the message is often that the move has been sharp, but not broad-based enough to look fully settled.
The MACD at 0.002 versus a signal line at -0.353, with a positive histogram of 0.355, points the other way. MACD is a trend-following indicator, and this setup says the short-term momentum has turned positive relative to its own baseline. In other words, the stock is trying to build upward traction even while the overbought stochastic warns that the pace may be too fast to sustain without a pause.
Momentum chart of AIA: RSI(14), MACD, Stochastic. Data: exchange via Yahoo Finance.
Volatility & Volume
Bollinger Bands give a useful map of where the stock sits in its recent price envelope. The upper band at 77.23, middle band at 74.02, and lower band at 70.80 show that AIA is trading well above the midline and just below the top of the band. The %B reading of 81% confirms that price is leaning toward the upper part of the range, not far from a zone where rallies often need stronger follow-through to continue.
The 8.7% band width is described as normal, not squeezed. That matters because a squeeze often hints at an imminent breakout; this is not that kind of setup. Instead, the market is in a more ordinary volatility regime, where price can still move, but without the compressed spring effect that tends to produce sharper directional expansion.
ATR at 1.92, or 2.5% of price, suggests volatility is moderate. For readers, ATR is a measure of typical daily movement. In practical terms, AIA is not behaving like a highly erratic stock right now, but the daily swings are large enough that any break of support or resistance could matter quickly.
Volume adds a caution flag. The latest volume of 28,844,946 was only 0.8x the 20-day average of 34,299,114, and OBV is falling. OBV, or on-balance volume, tracks whether volume is flowing into rises or declines. A falling OBV while price edges higher often means the rally is not yet fully supported by accumulation. That is a classic sign of a rebound that still needs proof.
Key Levels & Scenarios
The immediate levels to watch are clear. Resistance at 77.75 sits just above the upper Bollinger band at 77.23, so the stock is approaching a zone where upside may start to meet technical friction. On the downside, support at 70.40 lines up closely with the lower band at 70.80, making that area the key floor for the current setup.
The 3-month high at 82.85 and 3-month low at 69.05 frame the broader trading box. A move through resistance would start to shift attention back toward the upper end of that range. Failure to hold support would instead reopen the lower part of the band and bring the 3-month low back into view.
If price clears 77.75 with stronger volume, the chart would look more constructive. If it slips back below the mid-band area around 74.02 and loses the nearby support structure, the rebound would look less convincing. The current setup is therefore a test of whether momentum can become participation.
Technical Verdict: HOLD (wait & see)
- Reason 1: Price is above SMA20, and MACD is positive, which supports the short-term rebound.
- Reason 2: The death cross between SMA20 and SMA50 still signals a weaker medium-term trend.
- Reason 3:Stochastic is overbought and OBV is falling, so the recent advance lacks strong volume confirmation.
- Invalidation condition: this verdict is invalidated if price falls below 70.40.
- Ideal Entry Range:74.02 to 74.70 HKD
- Exit Target:77.23 to 77.75 HKD
- Stop Loss protection:70.40 HKD
In plain English: AIA is trying to recover, but the chart still needs better confirmation before the move looks dependable.
The latest 3-month low is 69.05.